WBC Elliott Wave technical analysis
Today's Elliott Wave analysis focuses on the Australian Stock Exchange (ASX) and WESTPAC BANKING CORPORATION (WBC).
We observe weakness in ASX:WBC, indicating a medium-term bearish trend. This analysis provides insights into potential trend movements and key price levels where a possible trend reversal might occur.
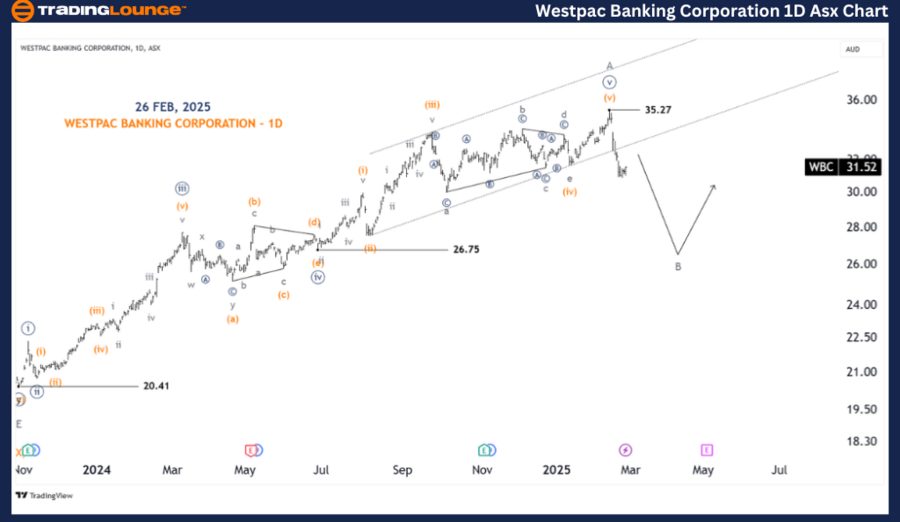
ASX: WESTPAC BANKING CORPORATION – WBC Elliott Wave Technical Analysis (1D Chart – Semilog Scale)
Analysis:
-
Function: Major Trend (Minute Degree, Green)
-
Mode: Motive
-
Structure: Impulse
-
Position: Wave B (Grey) of Wave (Y) (Orange)
Details:
-
Wave A (Grey) ended at 35.27, and Wave B (Grey) is currently moving lower, targeting 26.75.
-
This indicates the potential for a significant price drop, making long positions riskier.
Invalidation point:
-
35.27.
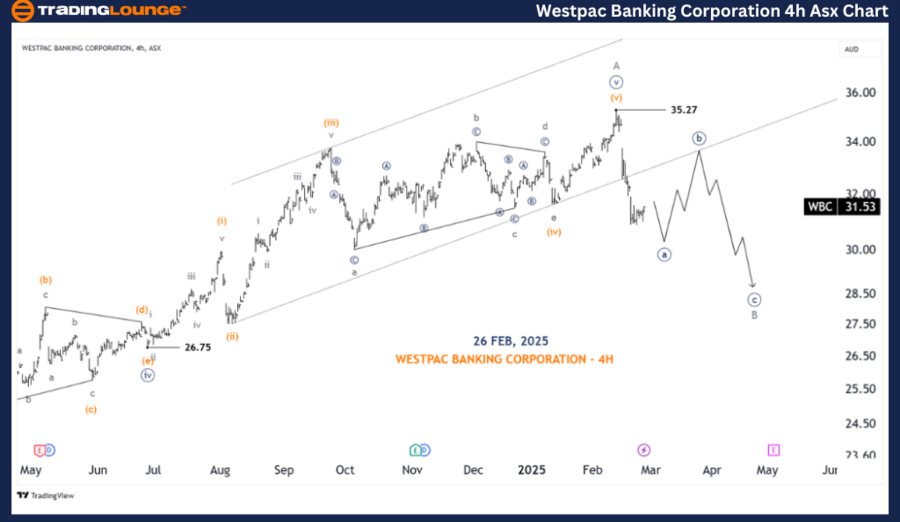
WBC Elliott Wave technical analysis (Four-hour chart)
ASX: WBC 4-Hour Chart Analysis.
Analysis:
-
Function: Major Trend (Minute Degree, Navy).
-
Mode: Motive.
-
Structure: Impulse.
-
Position: Wave ((a)) (Navy) of Wave B (Grey) of Wave (Y) (Orange).
Details:
-
Since the high at 35.27, Wave B (Grey) is unfolding with sharp and strong downward momentum.
-
The zigzag pattern is forming as ((a))((b))((c)).
-
Wave ((a)) (Navy) is near completion, after which Wave ((b)) (Navy) may retrace slightly higher before a final downward move in Wave ((c)) (Navy).
Invalidation point:
-
35.27.
Conclusion
Our Elliott Wave forecast for ASX: WESTPAC BANKING CORPORATION (WBC) provides traders with a comprehensive outlook on market trends and potential trading opportunities.
By identifying key validation and invalidation price points, we help traders enhance their market confidence and decision-making process. Our goal is to provide the most objective, data-driven, and professional analysis of WBC’s price movements.
Technical analyst:
Hua (Shane) Cuong, CEWA-M (Master’s Designation).
WBC Elliott Wave technical analysis [Video]
As with any investment opportunity there is a risk of making losses on investments that Trading Lounge expresses opinions on.
Historical results are no guarantee of future returns. Some investments are inherently riskier than others. At worst, you could lose your entire investment. TradingLounge™ uses a range of technical analysis tools, software and basic fundamental analysis as well as economic forecasts aimed at minimizing the potential for loss.
The advice we provide through our TradingLounge™ websites and our TradingLounge™ Membership has been prepared without considering your objectives, financial situation or needs. Reliance on such advice, information or data is at your own risk. The decision to trade and the method of trading is for you alone to decide. This information is of a general nature only, so you should, before acting upon any of the information or advice provided by us, consider the appropriateness of the advice considering your own objectives, financial situation or needs. Therefore, you should consult your financial advisor or accountant to determine whether trading in securities and derivatives products is appropriate for you considering your financial circumstances.
Recommended content
Editors’ Picks

EUR/USD attacks 1.0800 ahead of EU inflation data
EUR/USD is battling 1.0800 in the early European session on Tuesday, undermined by the latest US Dollar bounce. Traders keenly await the EU inflation data and the US jobs survey for further impetus as US President Trump's 'reciprocal tariffs' announcement looms on Wednesday.

GBP/USD treads water above 1.2900 ahead of US data, tariffs
GBP/USD is trading on the defensive while holding above 1.2900 in Tuesday's European trading. The pair loses ground amid a modest US Dollar uptick as traders resort to repositioning in the lead-up to the top-tier US economic data releases and Wednesday's tariffs announcements.

Gold price extends bullish trend amid rising trade tensions; fresh record high and counting
Gold price continues to scale new record highs for the fourth straight day on Tuesday. Worries about the widening global trade war and geopolitical risks boost the commodity. Fed rate cut bets weigh on the USD and further benefit the non-yielding yellow metal.

PEPE could rally to double digits if it breaks above its key resistance level
Pepe memecoin approaches its descending trendline, trading around $0.000007 on Tuesday; a breakout indicates a bullish move ahead. Moreover, PEPE's long-to-short ratio supports a bullish thesis as bullish bets among the traders reach the highest over a month.

Is the US economy headed for a recession?
Leading economists say a recession is more likely than originally expected. With new tariffs set to be launched on April 2, investors and economists are growing more concerned about an economic slowdown or recession.

The Best brokers to trade EUR/USD
SPONSORED Discover the top brokers for trading EUR/USD in 2025. Our list features brokers with competitive spreads, fast execution, and powerful platforms. Whether you're a beginner or an expert, find the right partner to navigate the dynamic Forex market.