ASX: WESTPAC BANKING CORPORATION - WBC Elliott Wave Technical Analysis TradingLounge.
Greetings,
Today's Elliott Wave analysis provides an updated perspective on the Australian Stock Exchange (ASX) focusing on WESTPAC BANKING CORPORATION (WBC).
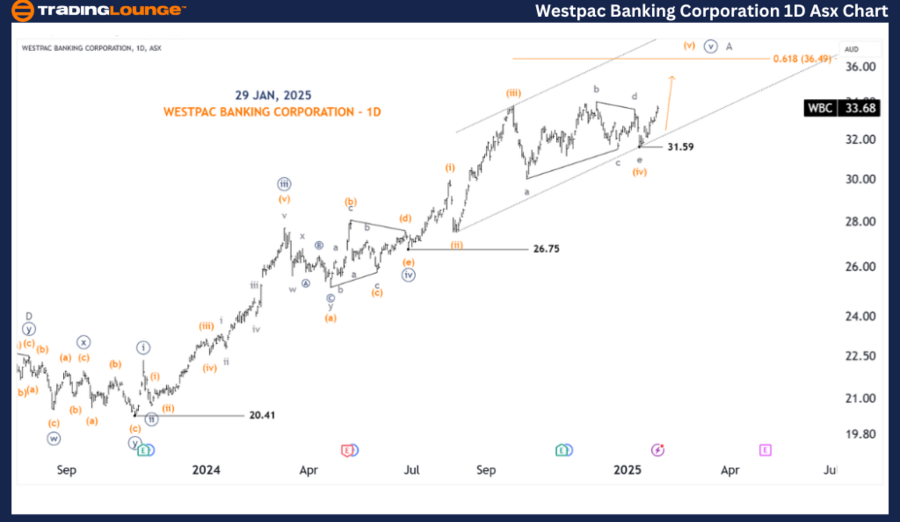
Our analysis indicates that ASX: WBC may have completed a Triangle pattern, suggesting an upward movement. This evaluation also highlights key price levels to help traders determine whether this scenario remains valid, when it is invalidated, and when a bullish confirmation trend is likely to emerge.
WBC (one day chart, semilog scale)
-
Function: Major Trend (Minute degree, navy).
-
Mode: Motive.
-
Structure: Impulse.
-
Position: Wave (v) - orange of Wave ((v)) - navy.
Details:
Our analysis identifies a Triangle pattern, with the fourth wave recently completing at a low of 31.59. This setup is followed by the (v) - orange wave, which has begun unfolding in an upward direction. The target price is projected to reach around 36.49 or as high as the upper edge of the channel.
For this scenario to remain valid, the price must stay above 31.59.
-
Invalidation point: 31.59.
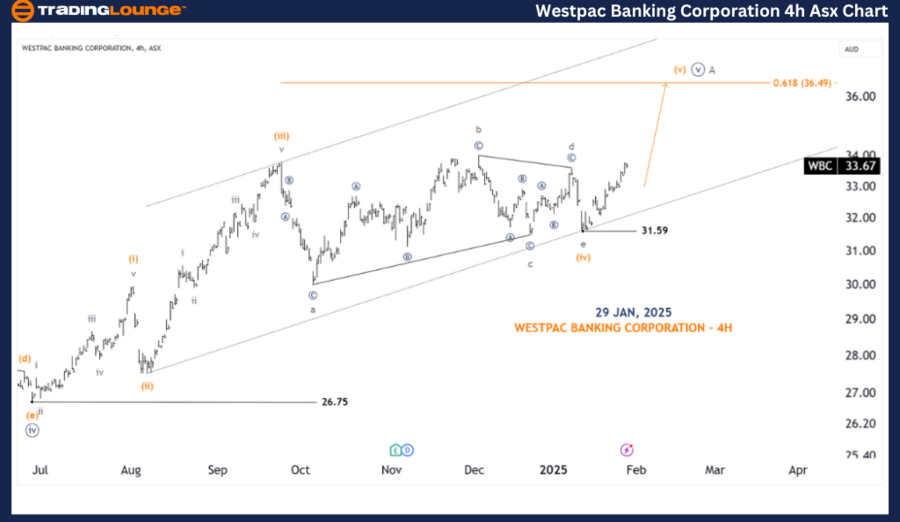
WBC (four-hour chart)
-
Function: Major Trend (Minor degree, grey).
-
Mode: Motive.
-
Structure: Impulse.
-
Position: Wave (v) - orange.
Details:
The Triangle formation appears to have completed, with the price pushing above the end of wave d - grey. In the short term, the price is expected to move towards the nearest target at 0.618 Fibonacci ratio of wave (v) to wave (i).
-
Invalidation point: 31.59.
Conclusion:
Our Elliott Wave analysis for ASX: WESTPAC BANKING CORPORATION - WBC provides key insights into current market trends, helping traders make informed decisions. By identifying critical price levels that validate or invalidate our wave count, we enhance confidence in our forecast.
By integrating these technical factors, we deliver a professional and objective perspective on market trends, equipping traders with actionable insights for effective decision-making.
Technical analyst:
Hua (Shane) Cuong, CEWA-M (Master’s Designation).
ASX: Westpac Banking Corporation - WBC Elliott Wave technical analysis [Video]
As with any investment opportunity there is a risk of making losses on investments that Trading Lounge expresses opinions on.
Historical results are no guarantee of future returns. Some investments are inherently riskier than others. At worst, you could lose your entire investment. TradingLounge™ uses a range of technical analysis tools, software and basic fundamental analysis as well as economic forecasts aimed at minimizing the potential for loss.
The advice we provide through our TradingLounge™ websites and our TradingLounge™ Membership has been prepared without considering your objectives, financial situation or needs. Reliance on such advice, information or data is at your own risk. The decision to trade and the method of trading is for you alone to decide. This information is of a general nature only, so you should, before acting upon any of the information or advice provided by us, consider the appropriateness of the advice considering your own objectives, financial situation or needs. Therefore, you should consult your financial advisor or accountant to determine whether trading in securities and derivatives products is appropriate for you considering your financial circumstances.
Recommended content
Editors’ Picks

EUR/USD struggles to find upside traction near 1.0950
EUR/USD remains below the 1.1000 barrier and trades with humble losses on the back of the acceptable rebound in the Greenback, as market participants continue to adjust to Trump's announcement of a 90-day pause on reciprocal tariffs on non-retaliating countries.

GBP/USD retakes 1.2800 and above
GBP/USD manages to keep the bullish bias despite the decent bounce in the US Dollar, navigating the area above 1.2800 the figure as investors continue to assess the ongoing US-China trade war. US doubles the bet, announced 125% levies on Chinese imports.

Gold remains bid, refocuses on $3,100
Prices of Gold now regain some balance and approach the $3,100 zone per troy ounce on Wednesday after President Trump announced a 90-day pause on reciprocal and 10% tariffs. FOMC Minutes pointed to further caution from officials.

Dow Jones Industrial Average rockets 6% higher on tariff suspension
The Dow Jones Industrial Average (DJIA) skyrocketed on Wednesday, surging over 6% on the day and returning to the 40,000 handle after the Trump administration announced yet another pivot on its own tariff policies.

Tariff rollercoaster continues as China slapped with 104% levies
The reaction in currencies has not been as predictable. The clear winners so far remain the safe-haven Japanese yen and Swiss franc, no surprises there, while the euro has also emerged as a quasi-safe-haven given its high liquid status.

The Best brokers to trade EUR/USD
SPONSORED Discover the top brokers for trading EUR/USD in 2025. Our list features brokers with competitive spreads, fast execution, and powerful platforms. Whether you're a beginner or an expert, find the right partner to navigate the dynamic Forex market.