ASX: SOL Elliott Wave technical analysis
Greetings, Our Elliott Wave analysis today updates the Australian Stock Exchange (ASX) WASHINGTON H SOUL PATTINSON & COMPANY LIMITED - SOL. We see ASX:SOL has a lot of upside potential with wave 3-grey.
ASX: SOL one-day chart (semilog scale) analysis
Function: Major trend (Minor degree, gray).
Mode: Motive.
Structure: Impulse.
Position: Wave 3-grey of Wave (3)-orange.
Details: Wave 2-grey may have ended as an Expanded Flat labeled ((a)),((b)),((c))-navy at a low around 32.52. And this wave 3-grey may be unfolding to push much higher.
Invalidation point: 32.52.
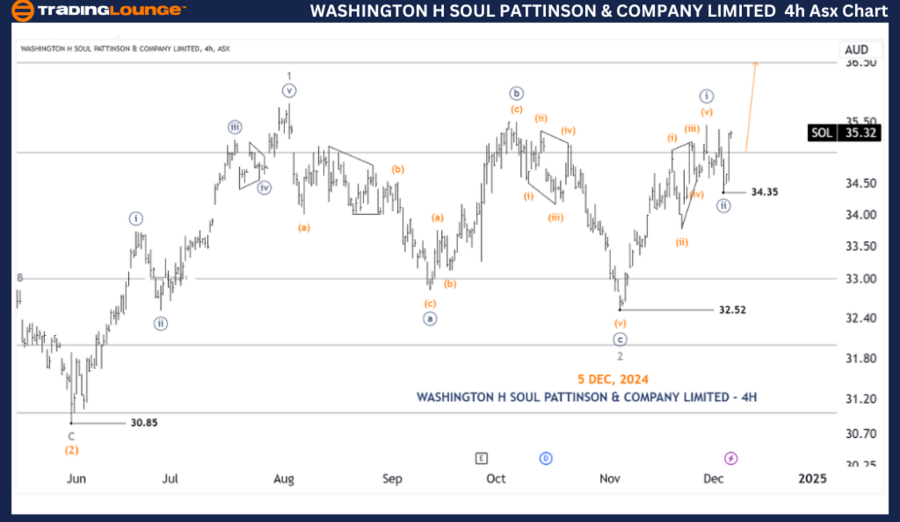
ASX: SOL four-hour chart analysis
Function: Major trend (Minor degree, grey).
Mode: Motive.
Structure: Impulse.
Position: Wave ((iii))-navy of Wave 3-grey.
Details: Since the low at 32.52 the ((i))-navy wave has probably just completed as a Leading Diagonal labeled from wave (i)-orange to wave (v)-orange, and wave ((ii))-navy is pushing lower after that. Diagonals are usually followed by strong moves with signal waves, but not here, so the question of whether wave ((iii))-navy is actually unfolding still needs to wait a few more days, meaning that price must remain above 34.35 to maintain this uptrend.
Invalidation point: 34.35.
Conclusion
Our analysis, forecast of contextual trends, and short-term outlook for ASX: WASHINGTON H SOUL PATTINSON & COMPANY LIMITED - SOL aim to provide readers with insights into the current market trends and how to capitalize on them effectively. We offer specific price points that act as validation or invalidation signals for our wave count, enhancing the confidence in our perspective. By combining these factors, we strive to offer readers the most objective and professional perspective on market trends.
Washington H Soul Pattinson & Company Limited Elliott Wave analysis [Video]
As with any investment opportunity there is a risk of making losses on investments that Trading Lounge expresses opinions on.
Historical results are no guarantee of future returns. Some investments are inherently riskier than others. At worst, you could lose your entire investment. TradingLounge™ uses a range of technical analysis tools, software and basic fundamental analysis as well as economic forecasts aimed at minimizing the potential for loss.
The advice we provide through our TradingLounge™ websites and our TradingLounge™ Membership has been prepared without considering your objectives, financial situation or needs. Reliance on such advice, information or data is at your own risk. The decision to trade and the method of trading is for you alone to decide. This information is of a general nature only, so you should, before acting upon any of the information or advice provided by us, consider the appropriateness of the advice considering your own objectives, financial situation or needs. Therefore, you should consult your financial advisor or accountant to determine whether trading in securities and derivatives products is appropriate for you considering your financial circumstances.
Recommended content
Editors’ Picks
![AUD/USD stretches higher above 0.6350 amid sustained US Dollar weakness](https://editorial.fxsstatic.com/images/i/AUD-neutral-object_Medium.png)
AUD/USD stretches higher above 0.6350 amid sustained US Dollar weakness
AUD/USD regains traction and climbs above 0.6350 in the Asian session on Monday. The sustained US Dollar weakness and prospects of Russia-US meeting outweigh dovish RBA expectations, supporting the pair amid a US holiday-thinned market. All eyes remain on Tuesday's RBA interest rate decision.
![USD/JPY weakens to sub-152.00 levels after upbeat Japan's Q4 GDP data](https://editorial.fxsstatic.com/images/i/JPY-bearish-line_Medium.png)
USD/JPY weakens to sub-152.00 levels after upbeat Japan's Q4 GDP data
USD/JPY weakens below 152.00 following the release of Japan's prelimimary GDP report, which showed that the economy expanded 0.7% QoQ and 2.8% YoY in Q4. The data blew past market expectations and reaffirmed bets for another BoJ rate hike, boosting the Japanese Yen.
![Gold rebounds toward $2,900 on risk recovery](https://editorial.fxsstatic.com/images/i/Commodities_Gold-2_Medium.jpg)
Gold rebounds toward $2,900 on risk recovery
Gold price finds demand and reverts toward $2,900 in the Asian session on Monday. Easing global trade war fears and prospects of an end to the Russia-Ukraine conflict amid Tuesday's meeting between the US and Russia lift risk sentiment and Gold price at the expense of the US Dollar.
![Week ahead: Fed Minutes, RBA and RBNZ decisions in focus](https://editorial.fxsstatic.com/images/i/Federal-Reserve-Building_3_Medium.png)
Week ahead: Fed Minutes, RBA and RBNZ decisions in focus
After Powell and CPI data, dollar traders turn to Fed minutes. RBA to cut rates by 25bps, focus on forward guidance. RBNZ may opt for a third consecutive 50bps rate cut. UK, Canadian and Japan’s CPI data also in focus.
![Tariffs likely to impart a modest stagflationary hit to the economy this year](https://editorial.fxsstatic.com/images/i/Economic-Indicator_GDP-3_Medium.png)
Tariffs likely to impart a modest stagflationary hit to the economy this year
The economic policies of the Trump administration are starting to take shape. President Trump has already announced the imposition of tariffs on some of America's trading partners, and we assume there will be more levies, which will be matched by foreign retaliation, in the coming quarters.
![The Best Brokers of the Year](https://editorial.fxsstatic.com/images/Brokers/Editors_Pick_Box_395x179_Medium.png)
The Best Brokers of the Year
SPONSORED Explore top-quality choices worldwide and locally. Compare key features like spreads, leverage, and platforms. Find the right broker for your needs, whether trading CFDs, Forex pairs like EUR/USD, or commodities like Gold.