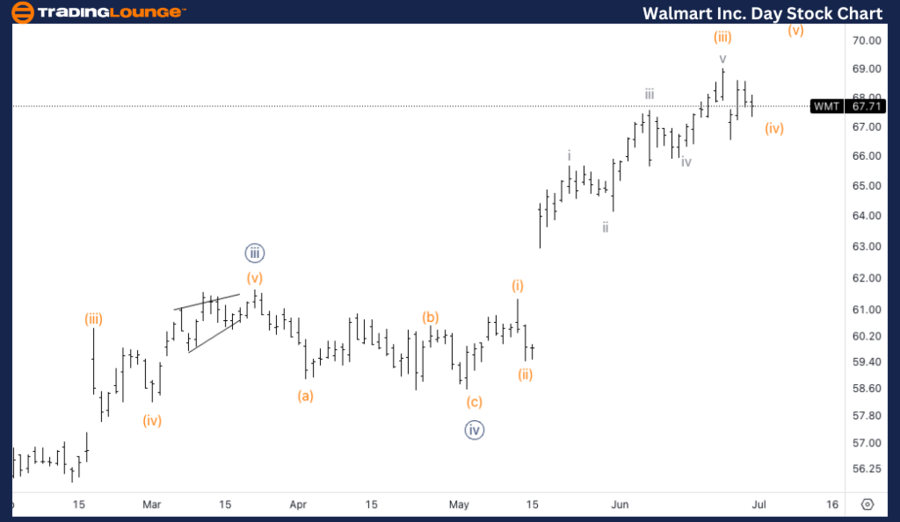
Walmart Inc., (WMT) Daily Chart.
WMT Elliott Wave technical analysis
Function: Trend.
Mode: Impulsive.
Structure: Motive.
Position: Minute {v}.
Direction: Top in wave {v}.
Details: We are looking for a five wave move into Minute {v}, considering {iii} was near equality of {i}, we could expect an extension in wave {v}. We also just surpassed 0.618 {v} vs. {iii}, with equality being the next target at 72$.
WMT Elliott Wave technical analysis – Daily chart
We are looking for a continuation of the five-wave move into Minute wave {v}. Given that wave {iii} was near the equality of wave {i}, there is an expectation for an extension in wave {v}. The recent surpassing of the 0.618 projection of {v} compared to {iii} suggests that the next target is the equality projection, which is approximately at 72$. This level could act as a significant resistance, and a potential completion point for wave {v}.
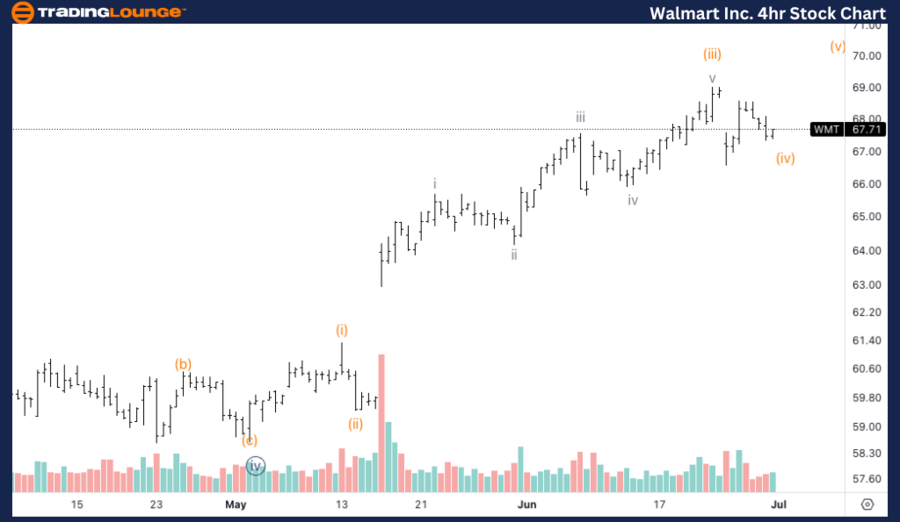
WMT Elliott Wave technical analysis – Four-hour chart
The analysis indicates that wave (iv) is currently unfolding, and there is an increase in volume during upward movements within wave (iv), confirming that we are in a corrective phase. This suggests a consolidation or pullback phase before resuming the final leg up in wave {v}. The end of wave (iv) will set the stage for the last impulse to complete the entire wave {v} structure.
Function: Trend
Mode: Impulsive
Structure: Motive
Position: Wave (iv) of {v}.
Direction: Bottom in wave (iv).
Details: We see volume increasing on the moves up of wave (iv) which gives us additional confirmation we are in a corrective phase.
This Elliott Wave analysis for Walmart Inc. (WMT), examines the current market structure and potential future movements using Elliott Wave principles. The analysis provides insights from both the daily and 4-hour charts to offer a detailed understanding of WMT's price action and anticipated trends.
Walmart Inc. (WMT) Elliott Wave technical analysis [Video]
As with any investment opportunity there is a risk of making losses on investments that Trading Lounge expresses opinions on.
Historical results are no guarantee of future returns. Some investments are inherently riskier than others. At worst, you could lose your entire investment. TradingLounge™ uses a range of technical analysis tools, software and basic fundamental analysis as well as economic forecasts aimed at minimizing the potential for loss.
The advice we provide through our TradingLounge™ websites and our TradingLounge™ Membership has been prepared without considering your objectives, financial situation or needs. Reliance on such advice, information or data is at your own risk. The decision to trade and the method of trading is for you alone to decide. This information is of a general nature only, so you should, before acting upon any of the information or advice provided by us, consider the appropriateness of the advice considering your own objectives, financial situation or needs. Therefore, you should consult your financial advisor or accountant to determine whether trading in securities and derivatives products is appropriate for you considering your financial circumstances.
Recommended content
Editors’ Picks
EUR/USD stays firm above 1.0750, awaits German inflation data
![EUR/USD stays firm above 1.0750, awaits German inflation data](https://editorial.fxstreet.com/images/Markets/Currencies/Majors/EURUSD/money-59004818_XtraSmall.jpg)
EUR/USD holds gains above 1.0750 in European trading on Monday. The Euro capitalizes on France's far-right National Rally (RN) party win in the first round of elections while the US Dollar stays offered on renewed Fed rate cut bets. The focus stays on German inflation and US PMIs.
GBP/USD consolidates gains below 1.2700, as US PMIs loom
![GBP/USD consolidates gains below 1.2700, as US PMIs loom](https://editorial.fxstreet.com/images/Markets/Currencies/Majors/GBPUSD/iStock-472155766_XtraSmall.jpg)
GBP/USD consolidates the upside below 1.2700 in the European session on Monday. The US Dollar remains weighed down by dovish Fed expectations and the EUR/USD upsurge, keeping the pair supported ahead of the US ISM PMI data.
Gold price struggles for a firm intraday direction ahead of US PMI data
![Gold price struggles for a firm intraday direction ahead of US PMI data](https://editorial.fxstreet.com/images/Markets/Commodities/Metals/Gold/stacks-of-gold-bars-19033163_XtraSmall.jpg)
Gold price oscillates in a narrow trading band on Monday amid mixed fundamental cues. Rising bets for a September Fed rate cut weigh on the USD and lend support to the metal.
Bitcoin is breaking above the falling wedge
![Bitcoin is breaking above the falling wedge](https://editorial.fxstreet.com/images/Markets/Currencies/Cryptocurrencies/cryptocurrenciesusd_XtraSmall.jpg)
Bitcoin breaking above the falling wedge pattern on Monday signals a bullish move, with Ethereum and Ripple poised to follow as they find support at key levels, paving the way for an upside rally in the days ahead.
Significant month for US stock markets and currencies
![Significant month for US stock markets and currencies](https://editorial.fxstreet.com/images/Markets/Currencies/Majors/EURUSD/money-for-the-table-with-figures-gm118451521-10951870_XtraSmall.jpg)
This month sees important time cycles across a range of instruments suggesting that we are at a major pivot point. In this video we look at the significant turning point coming out very shortly on the S&P 500 that will also impact the other US indices.