Wall Street’s sell-off deepens on economic uncertainty, tariffs, and technical breakdowns

Wall street faces declines as consumer confidence drops and key support levels fail
Market overview: Another day of losses for US futures
US futures, including the Nasdaq, S&P 500, Dow, and Russell 2000, have experienced a significant decline for the second consecutive day. This downturn follows a series of unsuccessful attempts to maintain critical levels, highlighting the market's current volatility and uncertainty.
Economic data and policy risks weigh on sentiment
Beyond technical factors, recent economic data has painted a grim picture of slowing growth. The University of Michigan's consumer sentiment index plunged 10% to 64.7, reflecting mounting pessimism, while home sales dropped by 4.9% in January. Inflation expectations have also surged, adding to market concerns.
Investors are also reacting to trade policy uncertainty. President Donald Trump's announcement of potential tariffs on autos, semiconductors, and pharmaceuticals has sparked fears of rising costs and disrupted supply chains. Meanwhile, a Department of Justice investigation into UnitedHealth Group triggered a sell-off in healthcare stocks, further weighing on the broader market.
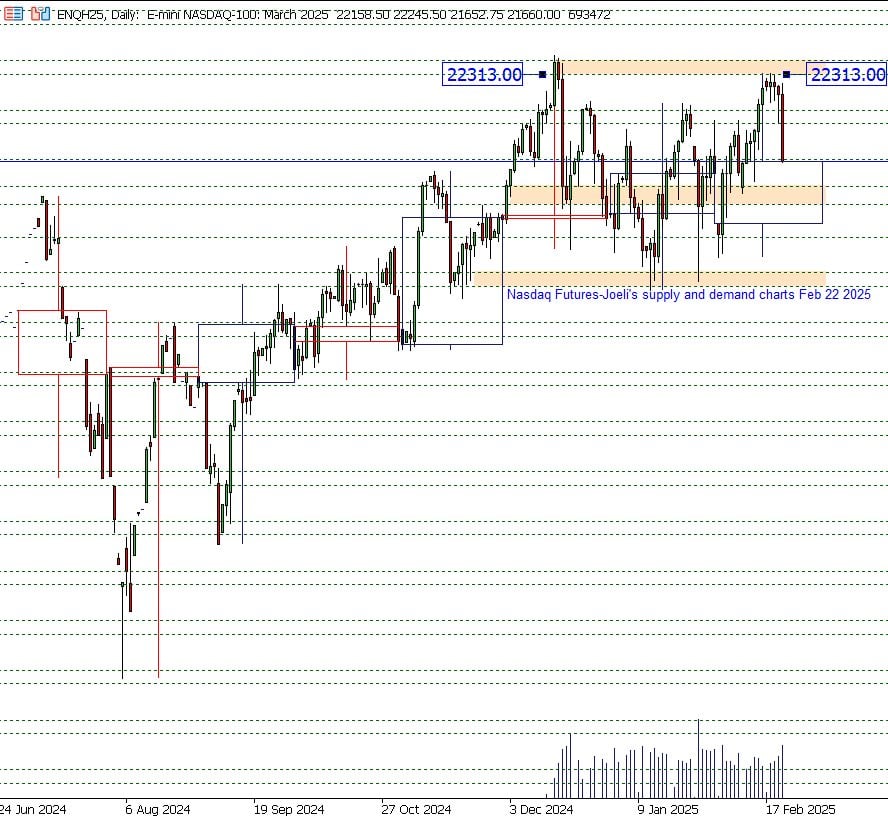
Nasdaq futures struggle at 22,313 resistance
The attached chart illustrates that the E-mini Nasdaq faced considerable resistance at the 22,313 zone at the beginning of the week. This failure to break through prompted a sharp sell-off that gained momentum over the past two days. By the close of trading on Friday, the Nasdaq index had dropped more than 2%, highlighting investors' hesitance amid declining confidence.
S&P 500 Futures unable to hold above 6,171
Similarly, the E-mini S&P 500 encountered major obstacles at key resistance levels, mirroring the struggles seen in Nasdaq Futures. Despite a push by bullish traders to surpass the critical 6,171 zone earlier in the week, the Index failed to sustain momentum. It closed down 1.75% on Friday as caution took hold and external economic concerns added to the downside pressure.
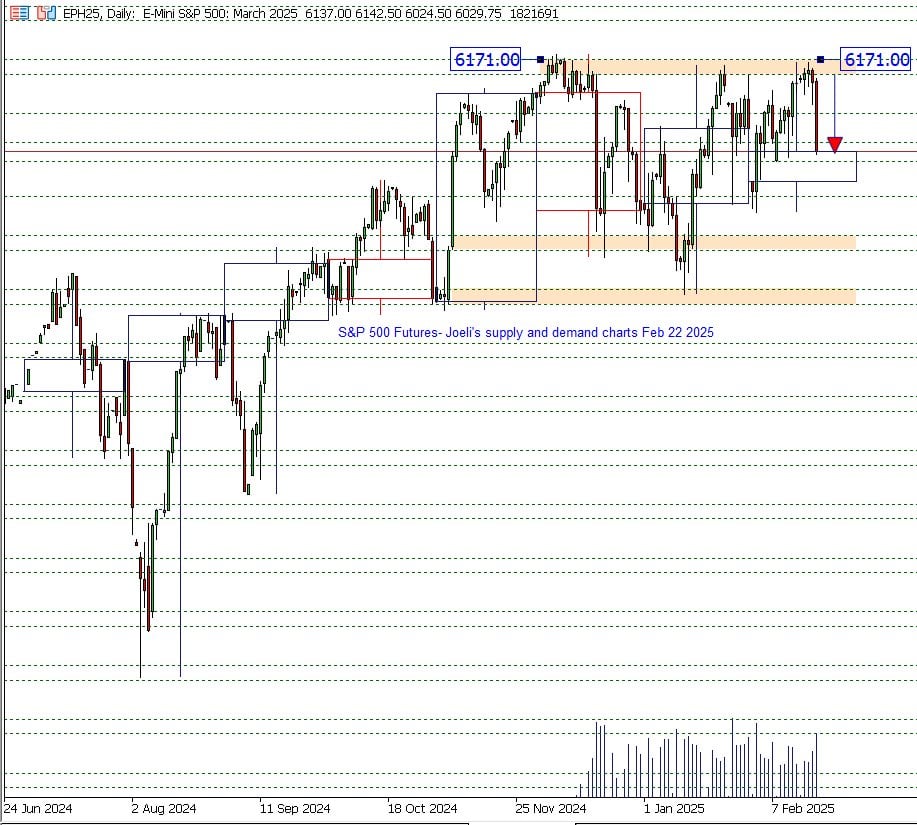
S&P 500 Futures combined daily and monthly price chart
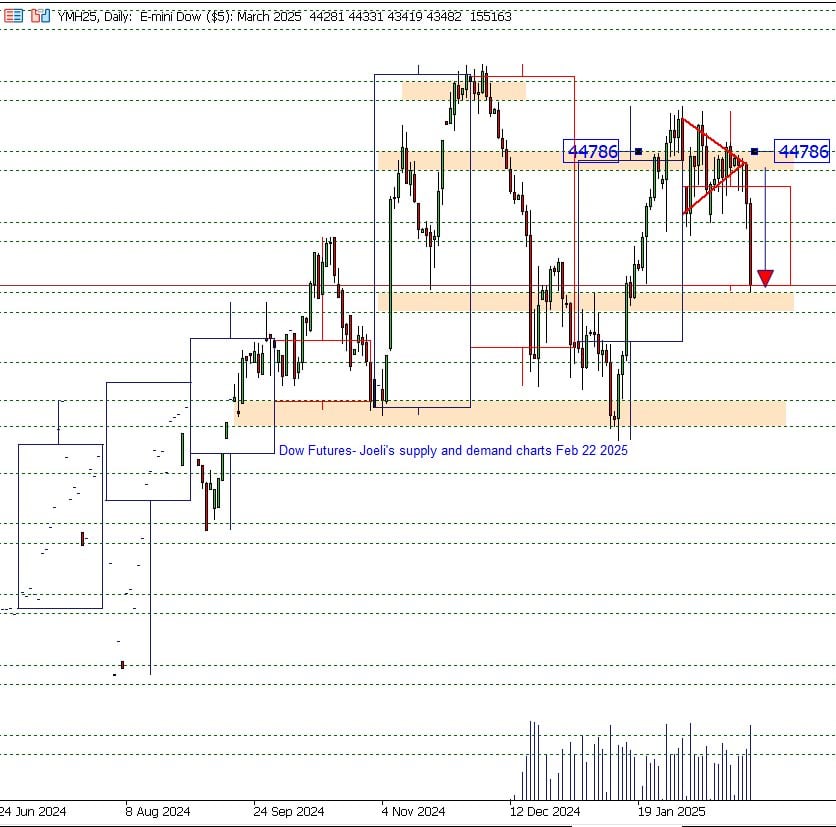
Dow Futures break down from consolidation pattern
Over the past three weeks, the E-mini Dow has formed a symmetrical triangle pattern with lower highs and lower lows. This technical formation typically signals indecision and consolidation before a breakout. In this case, the pattern led to a decisive move lower, contributing significantly to the sell-off. On Thursday, the E-mini Dow fell below the 44,786 critical zone, continuing its downward trajectory on Friday and closing down 1.77%. The Index found temporary support just above the 43,400 zone—an area traders will watch for potential rebounds or further declines.
Russell 2000 Futures lead the decline with risk of a deeper pullback or correction
Since early January, the E-mini Russell has struggled to break through the 2,331 zone, a key resistance level. This persistent weakness has led to a steady drift lower throughout February. Over the past three days, selling pressure has intensified, making the Russell the worst performer among the four major indices, down 2.97% in Friday’s session.
This decline reflects broader market concerns, particularly for small-cap stocks, as investors adopt a more cautious stance. The attached technical price structure, combining both the daily and monthly charts, suggests an increased risk of a deeper pullback. If the Index fails to hold at its current major support level, the likelihood of a broader correction could grow, further pressuring risk-sensitive assets.
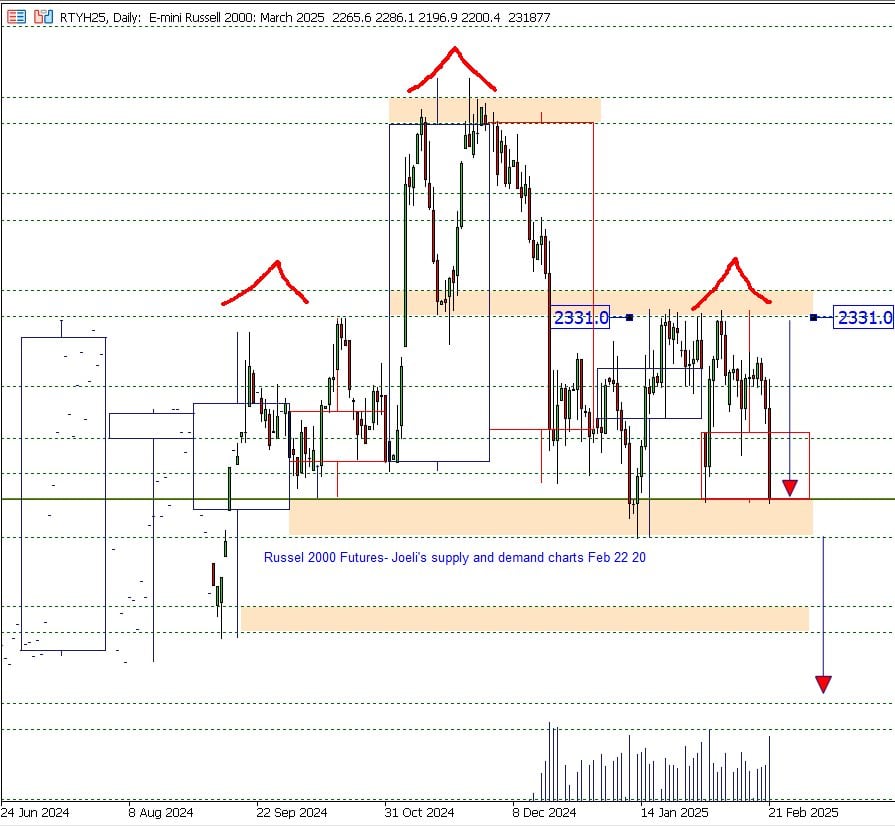
Russell 2000 Futures combined daily and monthly price chart.
Conclusion: A deeper pullback or temporary weakness?
The combination of technical breakdowns, weak economic data, tariff concerns, and corporate uncertainty has fueled this latest sell-off, creating a volatile environment across major indices. The key question now is whether this is a temporary correction or the beginning of a more extended downturn. With inflation expectations rising and policy risks growing, market participants will be watching upcoming economic data and Federal Reserve signals for clues on what's next for equities.
Author

Denis Joeli Fatiaki
Independent Analyst
Denis Joeli Fatiaki possesses over a decade of extensive experience as a multi-asset trader and Market Strategist.


