![]() Elliott Wave Forecast Team
Elliott Wave Forecast Team
ElliottWave-Forecast.com
Vistra Corp., (VST) operates as an integrated retail electricity & power generation company in the United States. It operates through five segments like Retail, Texas, East, West & Asset Closure. It comes under Utilities sector & trades as “VST” ticker at NYSE.
VST favors corrective pullback against March-2020 low in weekly. It expects to remain supported from extreme areas in correction to turn higher or at least 3 swing bounce against $67.65.
VST – Elliott Wave latest daily view
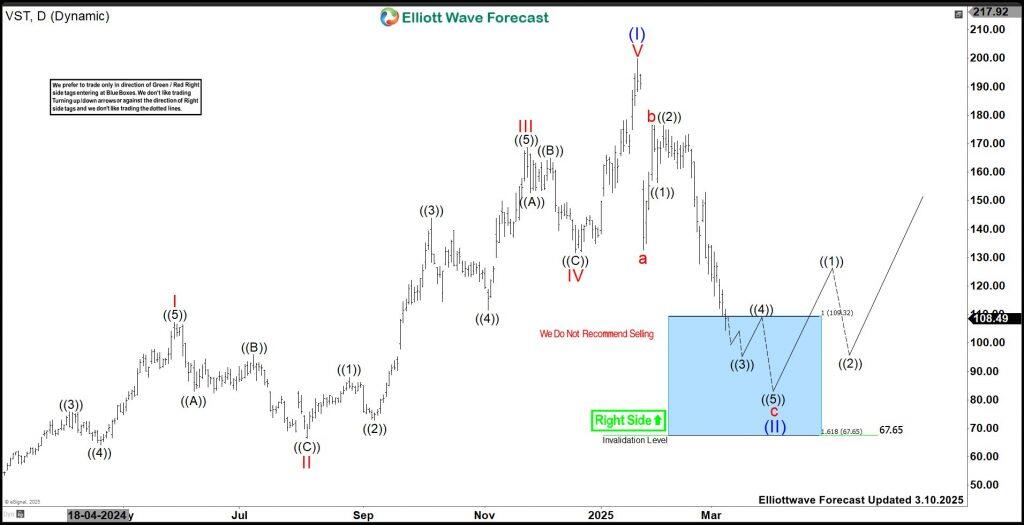
In Weekly, it made all time low of $11.30 in March-2020. Above that it ended impulse sequence of (I) at $199.84 high in January-2025. Within (I), it placed I at $107.24 high in May-2024 & II at $66.50 low as 0.382 Fibonacci retracement in August-2024. It placed III at $168.67 high in November-2024 & IV at $131.64 low in December-2024. Within III, it placed ((1)) at $87.89 high, ((2)) at $72.90 low, ((3)) at $143.87 high, ((4)) at $111.50 low & ((5)) at 168.67 high. Above IV low, it placed V at $199.84 high as (I) impulse.
Below $199.84 high, it started correcting lower in (II) against March-2020 low & expect to find support between $109.32 – $67.65 area to turn higher. It placed a at $132.59 low & b at $176.49 high. Below there, it favors downside in c to finish (II). It placed ((1)) at $156.28 low, ((2)) at $176.36 high &favors downside in ((3)) of c. It expects few more lows within daily extreme area to finish (II) before it rally in (III). We like to remain long from blue box area against $67.65 low. Alternatively, the bounce can be connector before unfolding double three correction in (II) against March-2020 low.
FURTHER DISCLOSURES AND DISCLAIMER CONCERNING RISK, RESPONSIBILITY AND LIABILITY Trading in the Foreign Exchange market is a challenging opportunity where above average returns are available for educated and experienced investors who are willing to take above average risk. However, before deciding to participate in Foreign Exchange (FX) trading, you should carefully consider your investment objectives, level of xperience and risk appetite. Do not invest or trade capital you cannot afford to lose. EME PROCESSING AND CONSULTING, LLC, THEIR REPRESENTATIVES, AND ANYONE WORKING FOR OR WITHIN WWW.ELLIOTTWAVE- FORECAST.COM is not responsible for any loss from any form of distributed advice, signal, analysis, or content. Again, we fully DISCLOSE to the Subscriber base that the Service as a whole, the individual Parties, Representatives, or owners shall not be liable to any and all Subscribers for any losses or damages as a result of any action taken by the Subscriber from any trade idea or signal posted on the website(s) distributed through any form of social-media, email, the website, and/or any other electronic, written, verbal, or future form of communication . All analysis, trading signals, trading recommendations, all charts, communicated interpretations of the wave counts, and all content from any media form produced by www.Elliottwave-forecast.com and/or the Representatives are solely the opinions and best efforts of the respective author(s). In general Forex instruments are highly leveraged, and traders can lose some or all of their initial margin funds. All content provided by www.Elliottwave-forecast.com is expressed in good faith and is intended to help Subscribers succeed in the marketplace, but it is never guaranteed. There is no “holy grail” to trading or forecasting the market and we are wrong sometimes like everyone else. Please understand and accept the risk involved when making any trading and/or investment decision. UNDERSTAND that all the content we provide is protected through copyright of EME PROCESSING AND CONSULTING, LLC. It is illegal to disseminate in any form of communication any part or all of our proprietary information without specific authorization. UNDERSTAND that you also agree to not allow persons that are not PAID SUBSCRIBERS to view any of the content not released publicly. IF YOU ARE FOUND TO BE IN VIOLATION OF THESE RESTRICTIONS you or your firm (as the Subscriber) will be charged fully with no discount for one year subscription to our Premium Plus Plan at $1,799.88 for EACH person or firm who received any of our content illegally through the respected intermediary’s (Subscriber in violation of terms) channel(s) of communication.


Recommended content
Editors’ Picks

AUD/USD: Rally continues to target 0.6400
AUD/USD’s upside momentum remained unchallenged on Tuesday, with the pair rising for the fifth consecutive daily advance and coming at shouting distance from the key resistance area in the 0.6400 neighbourhood.

EUR/USD: Correction has further legs to go
EUR/USD remained under pressure, adding to Monday’s retracement and breaking below the key 1.1300 support to reach two-day troughs, leaving the door open to the continuation of this correction in the short-term horizon.

Gold embarks on a consolidative move around $3,200
Gold is holding its own on Tuesday, trading just above $3,200 per troy ounce as it bounces back from earlier losses. While a more upbeat risk sentiment is bolstering the rebound, lingering concerns over a deepening global trade rift have prevented XAU/USD from rallying too aggressively.

Ethereum staking balance declines as whales resume buying
Ethereum is down 2% on Tuesday following a 120K ETH decline in the net balance of staking protocols in the past five days. While the decreasing staking balance could accelerate selling pressure, the resumption of whale buying activity could help the top altcoin defend a key ascending triangle's support.

Is a recession looming?
Wall Street skyrockets after Trump announces tariff delay. But gains remain limited as Trade War with China continues. Recession odds have eased, but investors remain fearful. The worst may not be over, deeper market wounds still possible.

The Best brokers to trade EUR/USD
SPONSORED Discover the top brokers for trading EUR/USD in 2025. Our list features brokers with competitive spreads, fast execution, and powerful platforms. Whether you're a beginner or an expert, find the right partner to navigate the dynamic Forex market.