Visa Inc. (V) Elliott Wave technical analysis [Video]
![Visa Inc. (V) Elliott Wave technical analysis [Video]](https://editorial.fxstreet.com/images/Markets/Equities/display-stock-market-charts-23026797_XtraLarge.jpg)
V Elliott Wave technical analysis
Function: Trend.
Mode: Impulsive.
Structure: Motive.
Position: Wave 1.
Direction: Upside in wave 1 of (5).
Details: Looking for a bottom in place in wave (4), as we seem to be resuming higher into wave (5). A break and retest of 280$ would provide additional confirmation.
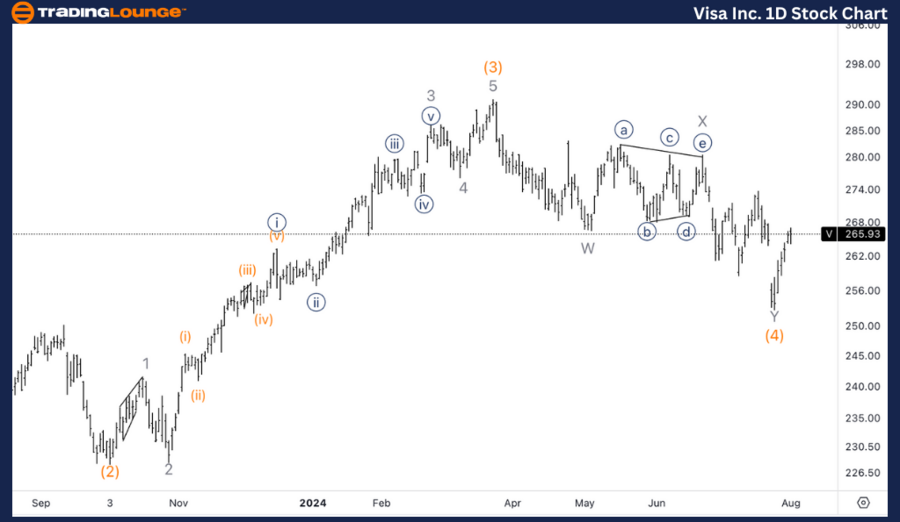
V Elliott Wave technical analysis – Daily chart
The analysis indicates that Visa has likely found a bottom in wave (4), and the price is resuming higher into wave (5). A break and retest of the $280 level would provide additional confirmation of this upward movement. This level is crucial as it would signify the transition from wave (4) to wave (5) and confirm the start of the next impulsive phase.
V Elliott Wave technical analysis
Function: Trend
Mode: Impulsive
Structure: Motive
Position: Wave {iii} of 1.
Direction: Upside in wave 1.
Details: Looking for additional upside within wave 1 as we are showing in details in the hourly chart. As all minor pullbacks seem clear three wave moves, we can expect further upside to come.
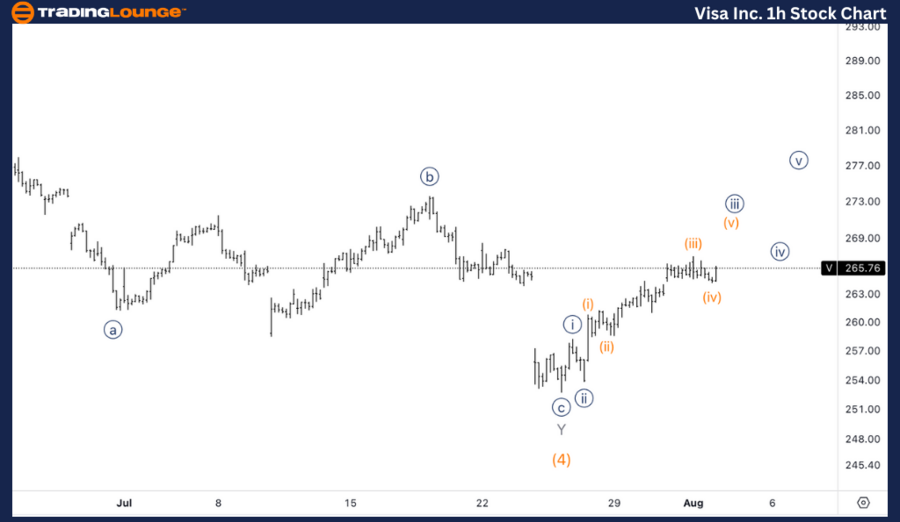
V Elliott Wave technical analysis – One-hour chart
The shorter time frame reveals that Visa is progressing within wave {iii} of 1. The hourly chart shows that all minor pullbacks appear to be clear three-wave corrective moves, which is typical within an impulsive wave structure. This pattern suggests that further upside is expected as wave {iii} continues to unfold.
This Elliott Wave analysis for Visa Inc. (V) examines both the daily and 1-hour charts to provide a comprehensive overview of the current market position and potential future movements.
Visa Inc. (V) Elliott Wave technical analysis [Video]
Author

Peter Mathers
TradingLounge
Peter Mathers started actively trading in 1982. He began his career at Hoei and Shoin, a Japanese futures trading company.


