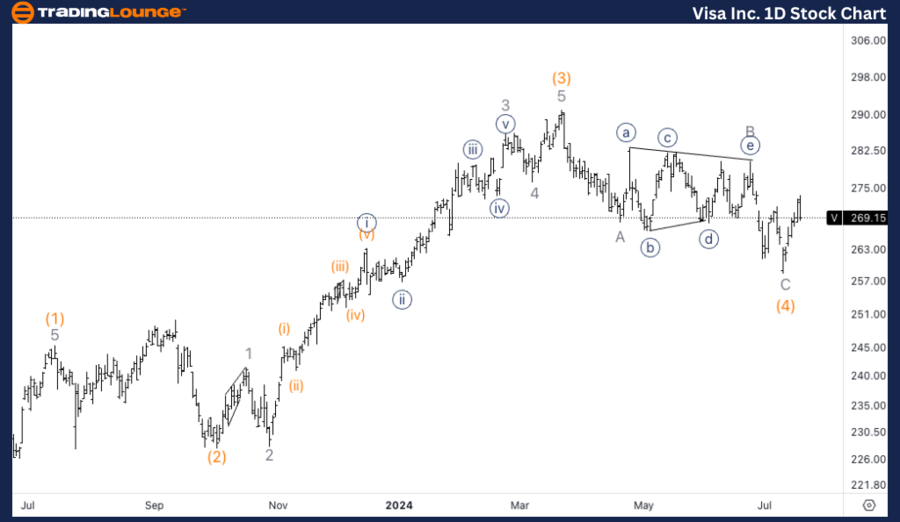
V Elliott Wave Analysis Trading Lounge Daily Chart,
Visa Inc., (V) Daily Chart.
V Elliott Wave technical analysis
Function: Trend.
Mode: Impulsive.
Structure: Motive.
Position: Wave 1.
Direction: Upside in wave 1.
Details: Looking for a bottom in wave (4) in place, after what seems to have been a clear three wave move that reached equality of C vs. A, very common target for wave C.
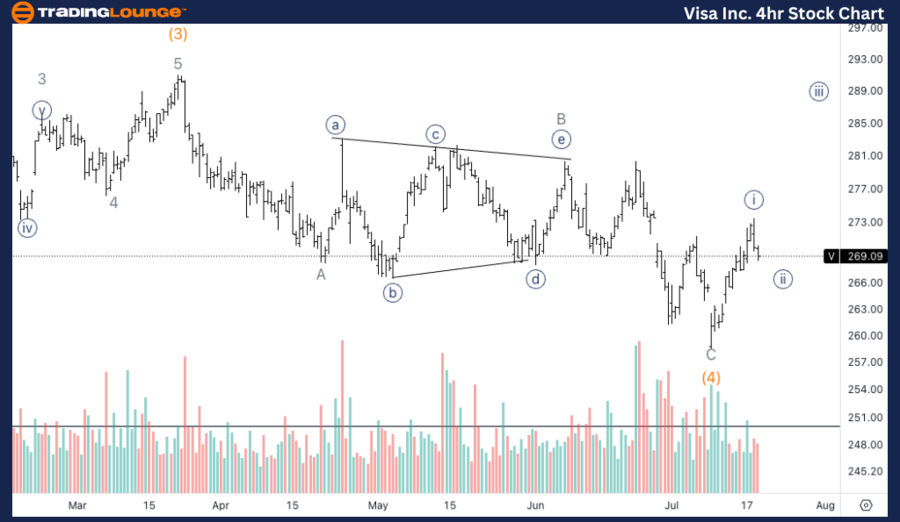
V Elliott Wave Analysis Trading Lounge 4Hr Chart,
Visa Inc., (V) 4Hr Chart.
V Elliott Wave technical analysis
Function: Trend.
Mode: Impulsive.
Structure: Motive.
Position: Wave {i} of 1.
Direction: Upside in wave {iii}.
Details: Looking for a clear five-wave move into Minor wave 1 to break 280$ and give us additional upside confirmation.
Welcome to our latest Elliott Wave analysis for Visa Inc. (V). This analysis provides an in-depth look at Visa's price movements using the Elliott Wave Theory, helping traders identify potential opportunities based on current trends and market structure. We will cover insights from both the daily and 4-hour charts to offer a comprehensive perspective on Visa's market behavior.
V Elliott Wave technical analysis – Daily chart
The daily chart suggests we are looking for a bottom in wave (4) to be in place, following what appears to be a clear three-wave corrective move. This move reached equality of wave C versus wave A, a common target for wave C. With wave (4) potentially complete, we anticipate the start of wave 1's upside movement.
V Elliott Wave technical analysis – Four-hour chart
The 4-hour chart indicates that we are looking for a clear five-wave move into Minor wave 1. Breaking above the $280 level will provide additional upside confirmation and signal the continuation of wave {iii} of 1. Traders should monitor the price action closely for this breakout to validate the bullish scenario.
Technical analyst: Alessio Barretta.
V Elliott Wave technical analysis [Video]
As with any investment opportunity there is a risk of making losses on investments that Trading Lounge expresses opinions on.
Historical results are no guarantee of future returns. Some investments are inherently riskier than others. At worst, you could lose your entire investment. TradingLounge™ uses a range of technical analysis tools, software and basic fundamental analysis as well as economic forecasts aimed at minimizing the potential for loss.
The advice we provide through our TradingLounge™ websites and our TradingLounge™ Membership has been prepared without considering your objectives, financial situation or needs. Reliance on such advice, information or data is at your own risk. The decision to trade and the method of trading is for you alone to decide. This information is of a general nature only, so you should, before acting upon any of the information or advice provided by us, consider the appropriateness of the advice considering your own objectives, financial situation or needs. Therefore, you should consult your financial advisor or accountant to determine whether trading in securities and derivatives products is appropriate for you considering your financial circumstances.
Recommended content
Editors’ Picks
EUR/USD holds positive ground near 1.0450, FOMC Minutes in focus
EUR/USD stays on the back foot and trades below 1.0450 after closing in the negative territory on Tuesday. The pair's short-term technical outlook highlights a bearish tilt.
Gold price renews all-time highs near $2,950
Gold price refreshes lifetime highs near $2,95 as trade war fears continue to underpin safe-haven asset. Fed rate cut bets keep the US Dollar bulls on the defensive and further lend support to the metal as traders await the release of the Fed Minutes later in American trading.
GBP/USD holds above 1.2600 after strong UK inflation data
GBP/USD holds steady above 1.2600 in the European session on Wednesday after the data from the UK showed that the annual CPI inflation climbed to 3% in January from 2.5% in December. Market focus shifts to mid-tier US data and FOMC Minutes.
Maker Price Forecast: MKR generates highest daily revenue of $10 million
Maker (MKR) price extends its gains by 6%, trading around $1,189 on Wednesday after rallying more than 20% so far this week. Artemis data shows that MKR generated $10 million in revenue on February 10, the new yearly high in daily revenue.
Rates down under
Today all Australian eyes were on the Reserve Bank of Australia, and rates were cut as expected. RBA Michele Bullock said higher interest rates had been working as expected, slowing economic activity and curbing inflation, but warned that Tuesday’s first rate cut since 2020 was not the start of a series of reductions.
The Best Brokers of the Year
SPONSORED Explore top-quality choices worldwide and locally. Compare key features like spreads, leverage, and platforms. Find the right broker for your needs, whether trading CFDs, Forex pairs like EUR/USD, or commodities like Gold.