Visa Inc.(V) Elliott Wave technical analysis [Video]
![Visa Inc.(V) Elliott Wave technical analysis [Video]](https://editorial.fxstreet.com/images/TechnicalAnalysis/ChartPatterns/PointFigure/hand-point-to-graph-on-financial-graphs-success-concept-73251403_XtraLarge.jpg)
V Elliott Wave technical analysis
Function: Trend.
Mode: Impulsive.
Structure: Motive.
Position: Wave (5).
Direction: Upside confirmation in wave (5).
Details: After what appears to be a clear three wave move to the downside, we are looking for upside resumption into wave (5).
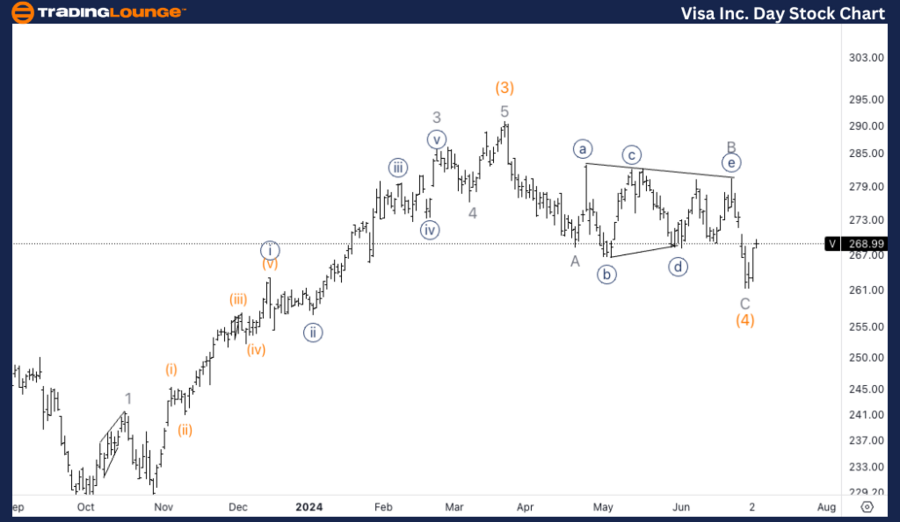
V Elliott Wave technical analysis – Daily chart
The daily chart indicates that V has completed a three-wave corrective move to the downside and is now set to resume its upward trend into wave (5). This wave is expected to confirm the continuation of the broader uptrend, potentially leading to new highs. Traders should watch for signs of this wave taking shape, focusing on higher highs and higher lows as the uptrend progresses.
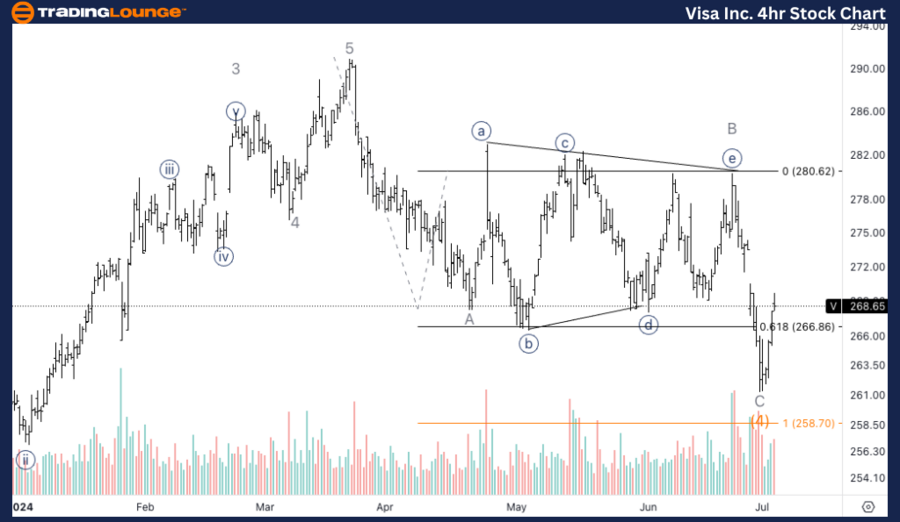
V Elliott Wave technical analysis – Four-hour chart
The 4-hour chart analysis shows that V is completing wave 1 of (5). We expect a five-wave move within this initial wave, followed by a counter trend three-wave corrective move to complete Minor wave 1. Additional upside confirmation would be provided by a break and retest of the end of Minor Group2 (MG2) at $280. This level could act as a significant pivot point for validating further upward movement.
Function: Trend
Mode: Impulsive
Structure: Motive
Position: Wave 1 of (5).
Direction: Completion of wave 1.
Details: Looking for a five wave move into Minor wave 1 followed by a countertrend three wave move, to have additional upside confirmation. A break and retest of the end of MG2 at 280$ would also provide an ideal trade setup.
Welcome to our latest Elliott Wave analysis for Visa Inc. (V). This analysis provides a detailed overview of V's price movements using the Elliott Wave Theory, aimed at helping traders identify potential trading opportunities based on current trends and market structure. We will cover insights from both the daily and 4-hour charts to offer a comprehensive perspective on Visa Inc.'s market behavior.
Visa Inc.(V) Elliott Wave technical analysis [Video]
Author

Peter Mathers
TradingLounge
Peter Mathers started actively trading in 1982. He began his career at Hoei and Shoin, a Japanese futures trading company.


