Visa Inc. (V) Elliott Wave technical analysis [Video]
![Visa Inc. (V) Elliott Wave technical analysis [Video]](https://editorial.fxstreet.com/images/Markets/Equities/HangSeng/hang-seng-index-17354816_XtraLarge.jpg)
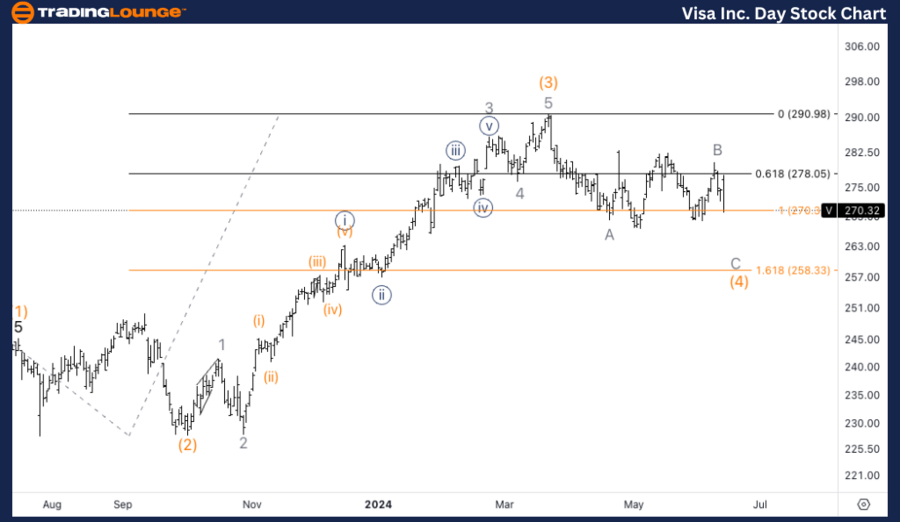
V Elliott Wave technical analysis
Function: Counter Trend.
Mode: Corrective.
Structure: Flat.
Position: Minor wave C.
DIirection: Downside in wave C.
Details: We are standing at equality of (4) vs. (2) at 270$. Looking for either a triangle in wave (4) or else, a triangle in wave B as displayed.
V Elliott Wave technical analysis – Daily chart
In our Elliott Wave analysis of Visa Inc. (V), we observe a counter-trend corrective pattern characterized by a Flat structure. V is currently positioned in Minor wave C, indicating a downside move in wave C. The analysis shows that V has reached the equality of wave (4) vs. wave (2) at $270. We are monitoring for either a triangle formation in wave (4) or a continuation pattern in wave B as depicted. Traders should watch for further declines and potential completion of wave C, with a focus on price behavior around the $270 level to gauge whether a triangle will form or if a more direct path downward will unfold.
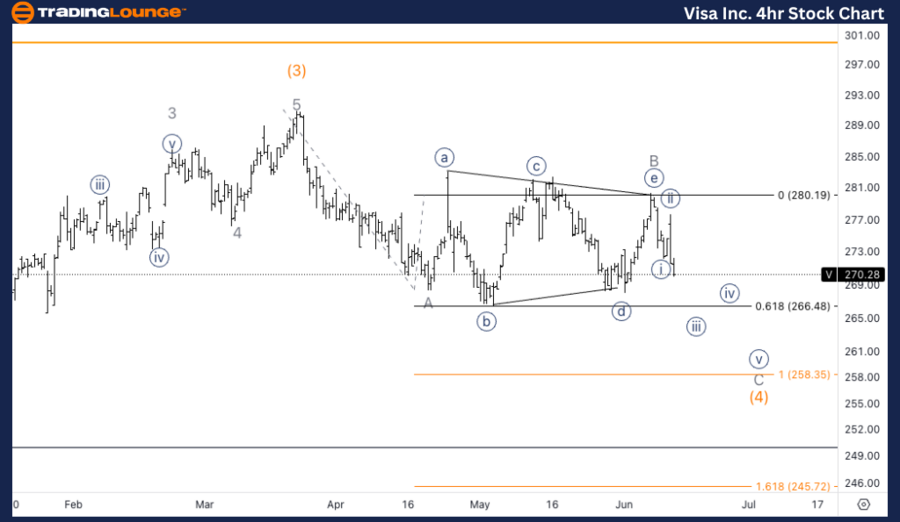
V Elliott Wave technical analysis – Four-hour chart
On the 4-hour chart, V is following a counter-trend corrective mode within a Flat structure, specifically in wave {iii} of C. The current analysis indicates that V is targeting equality of wave C vs. wave A at $258 as the main downside objective. This target serves as a key level for potential support where a bounce could occur. Traders should observe the approach to $258 closely, as this level may offer opportunities for positioning either for a short-term reversal or continuation based on further pattern development.
Function: Counter Trend.
Mode: Corrective.
Structure: Flat.
Position: Wave {iii} of C.
Direction: Downside in {iii}.
Details: Looking for equality of C vs. A as 258$ as main downside target for this scenario.
Welcome to our latest Elliott Wave analysis for Visa Inc. (V) as of June 13, 2024. This analysis provides an in-depth look at V's price movements using the Elliott Wave Theory, helping traders identify potential opportunities based on current trends and market structure. We will cover insights from both the daily and 4-hour charts to offer a comprehensive perspective on V's market behavior.
Visa Inc. (V) Elliott Wave technical analysis [Video]
Author

Peter Mathers
TradingLounge
Peter Mathers started actively trading in 1982. He began his career at Hoei and Shoin, a Japanese futures trading company.


