|

Visa Inc nest structure signals further upside

Visa Inc (NYSE: V) is an American multinational payment card services corporation headquartered in San Francisco, California. It facilitates electronic funds transfers throughout the world, most commonly through Visa-branded credit cards, debit cards and prepaid cards. This article dives into the potential technical trajectories within its weekly cycle using Elliott Wave Theory.

In November 2023, Visa stock surged into new all time highs after breaking above 2021 peak. The move created a weekly bullish sequence and it will be looking for a higher target at least toward equal legs area $425 – $581.

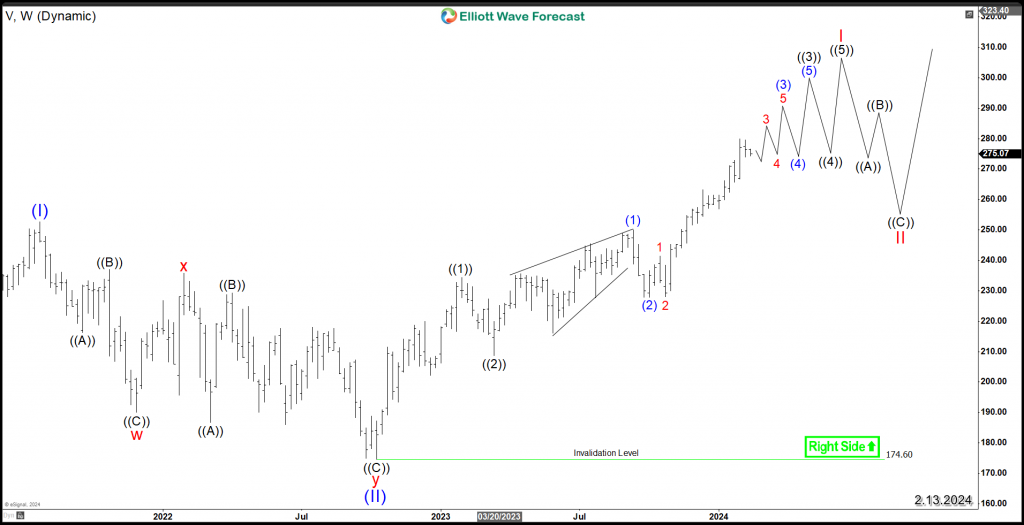
The Initial rally from October 2022 low is proposed to unfold as a bullish nest within wave I of (III). The rally within the 3rd wave usually has the strongest momentum within a regular impulse. The price action is more supported to the upside while pullbacks are short-lived because buyers will keep entering the market after 3 , 7 or 11 swings as long as the trend stays intact.

The stock will continue the rally within a series of 4th & 5th waves until it finish the 5 waves advance within wave I. After ending that cycle, a correction within wave II will take place presenting a potential new investment opportunity to join the weekly bullish trend as the stock is still proposed to be rallying within wave (III).

The weekly bullish sequence will support Visa in the coming years therefore investors are advised to keep an eye for the daily corrective pullbacks to be able to join then bullish trend.

V weekly chart 2.13.2024

Chart

Author

Elliott Wave Forecast Team

Elliott Wave Forecast Team

ElliottWave-Forecast.com

More from Elliott Wave Forecast Team
Share:

Markets move fast. We move first.

Orange Juice Newsletter brings you expert driven insights - not headlines. Every day on your inbox.

By subscribing you agree to our Terms and conditions.

Editor's Picks

EUR/USD flatlines below 1.1800 ahead of Fed Minutes

EUR/USD struggles to find direction and continues to move sideways below 1.1800 for the second consecutive day on Tuesday as markets remain in holiday mood. Later in the American session, the Federal Reserve will publish the minutes of the December policy meeting.

GBP/USD retreats to 1.3500 area following earlier climb

GBP/USD loses its traction and trades flat on the day near 1.3500 after rising to the 1.3530 area early Tuesday. Trading conditions remain thin ahead of the New Year holiday, limiting the pair's volatility. The Fed will publish December meeting minutes in the late American session.

Gold aims to regain the ground lost

Gold gathers recovery momentum and advances toward $4,400 on Tuesday after losing more than 4% on Monday. Increased margin requirements on gold and silver futures by the Chicago Mercantile Exchange Group, one of the world’s largest trading floors for commodities, prompted widespread profit-taking and portfolio rebalancing.

Tron steadies as Justin Sun invests $18 million in Tron Inc.

Tron (TRX) trades above $0.2800 at press time on Monday, hovering below the 50-day Exponential Moving Average (EMA) at $0.2859.

Economic outlook 2026-2027 in advanced countries: Solidity test

After a year marked by global economic resilience and ending on a note of optimism, 2026 looks promising and could be a year of solid economic performance. In our baseline scenario, we expect most of the supportive factors at work in 2025 to continue to play a role in 2026.

Crypto market outlook for 2026

Year 2025 was volatile, as crypto often is.  Among positive catalysts were favourable regulatory changes in the U.S., rise of Digital Asset Treasuries (DAT), adoption of AI and tokenization of Real-World-Assets (RWA).