V300AEQ ETF Units Elliott Wave technical forecast [Video]
![V300AEQ ETF Units Elliott Wave technical forecast [Video]](https://editorial.fxstreet.com/images/Markets/Equities/Industries/Food/woman-buying-supermarket_XtraLarge.jpg)
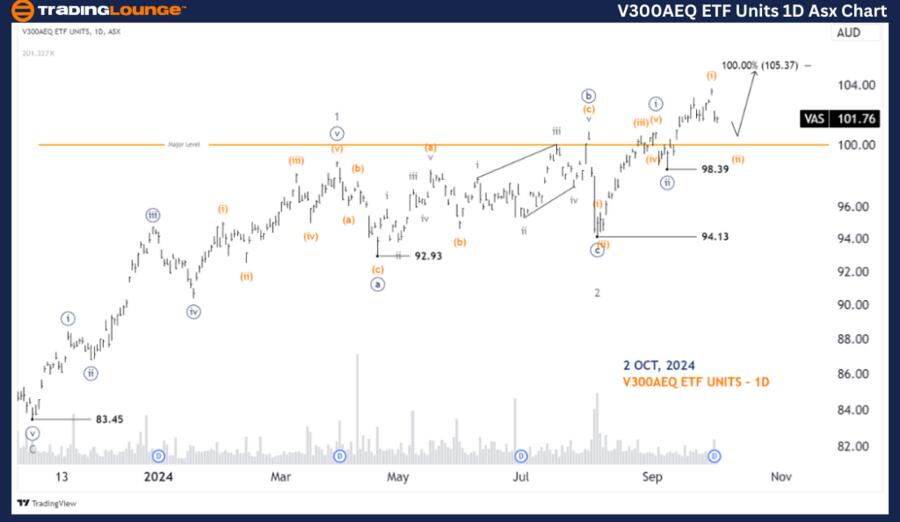
ASX: V300AEQ ETF UNITS – VAS Elliott Elliott Wave Technical Analysis TradingLounge (one-day chart)
Greetings, Our Elliott Wave analysis today updates the Australian Stock Exchange (ASX) with V300AEQ ETF UNITS – VAS. We see that VAS may have finished wave 2-grey, and wave 3-grey is unfolding to push higher.
VAS Elliott Elliott Wave technical analysis
Function: Major trend (Minor degree, grey).
Mode: Motive.
Structure: Impulse.
Position: Wave (ii)-orange of Wave ((iii))-navy of Wave 3-grey.
Details: Wave (i)-orange has just completed, and wave (ii)-orange is unfolding to push lower, eventually wave (iii)-orange may return to push higher.
Invalidation point: 98.39.
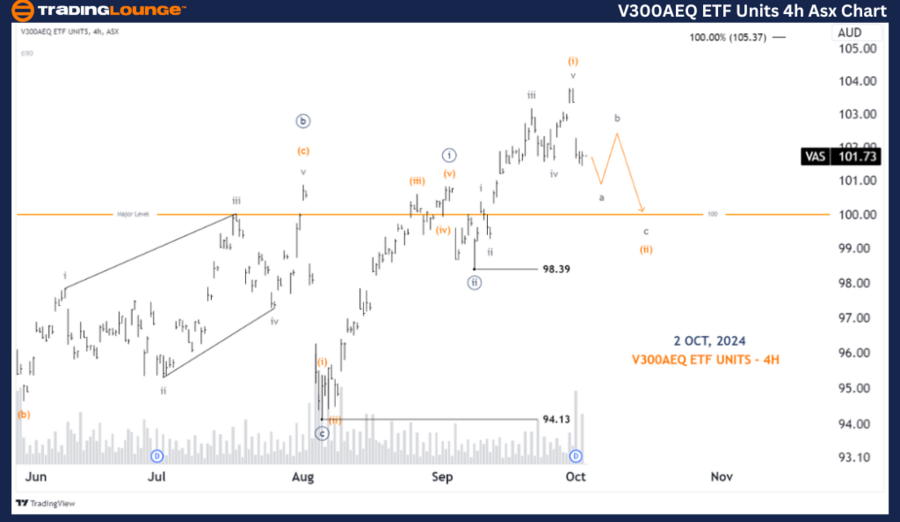
ASX: V300AEQ ETF Units – Four-hour chart analysis
Function: Major trend (Minute degree, navy).
Mode: Motive.
Structure: Impulse.
Position: Wave (ii)-orange of Wave ((iii))-navy.
Details: In the shorter term, wave (i)-orange has completed the five-waves, and wave (ii)-orange is unfolding to push lower as a Zigzag. Finally wave (iii)-orange will return to its work and continue pushing higher.
Invalidation point: 98.39.
Conclusion
Our analysis, forecast of contextual trends, and short-term outlook for ASX: V300AEQ ETF UNITS – VAS aim to provide readers with insights into the current market trends and how to capitalize on them effectively. We offer specific price points that act as validation or invalidation signals for our wave count, enhancing the confidence in our perspective. By combining these factors, we strive to offer readers the most objective and professional perspective on market trends.
V300AEQ ETF Units Elliott Wave technical forecast [Video]
Author

Peter Mathers
TradingLounge
Peter Mathers started actively trading in 1982. He began his career at Hoei and Shoin, a Japanese futures trading company.


