V300AEQ ETF Units Elliott Wave technical forecast [Video]
![V300AEQ ETF Units Elliott Wave technical forecast [Video]](https://editorial.fxstreet.com/images/Markets/Equities/Industries/Pharma/man-looking-microscope_XtraLarge.jpg)
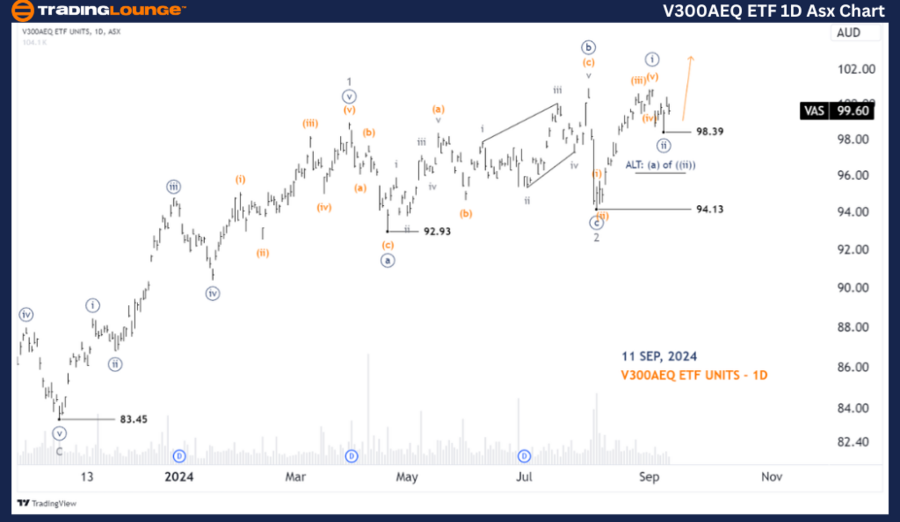
Greetings, Our Elliott Wave analysis today updates the Australian Stock Exchange (ASX) with V300AEQ ETF UNITS – VAS. We see that VAS may have finished wave 2-grey, and wave 3-grey is unfolding to push higher.
ASX: V300AEQ ETF Units – One-day chart analysis
Function: Major trend (Minor degree, grey).
Mode: Motive.
Structure: Impulse.
Position: Wave ((iii))-navy of Wave 3-grey.
Details: Wave 2-grey just ended at the 94.13 low as an Expanded Flat. Wave 3-grey is unfolding to push much higher, it is subdividing and has just completed wave ((i)),((ii))-navy, now wave ((iii))-navy is probably unfolding to push much higher. The push below 98.39 suggests that the entire wave ((ii))-navy is extending longer than expected, but the end result is still wave ((iii))-navy will continue to push higher afterwards.
Invalidation point: 98.39.
ASX: V300AEQ ETF Units – Four-hour chart analysis
Function: Major trend (Minute degree, navy).
Mode: Motive.
Structure: Impulse.
Position: Wave ((iii))-navy.
Details: Wave ((i))-navy just completed as Five-waves, wave ((ii))-navy also seems to have completed as Zigzag at the 98.39 low. Wave ((iii))-navy seems to be unfolding to push much higher. Pushing lower than that low, suggests wave ((ii))-navy is extending longer than expected. I am looking for trading setups around the Major 100.00 level.
Invalidation point: 98.39.
Conclusion
Our analysis, forecast of contextual trends, and short-term outlook for ASX: V300AEQ ETF UNITS – VAS aim to provide readers with insights into the current market trends and how to capitalize on them effectively. We offer specific price points that act as validation or invalidation signals for our wave count, enhancing the confidence in our perspective. By combining these factors, we strive to offer readers the most objective and professional perspective on market trends.
V300AEQ ETF Units Elliott Wave technical forecast [Video]
Author

Peter Mathers
TradingLounge
Peter Mathers started actively trading in 1982. He began his career at Hoei and Shoin, a Japanese futures trading company.


