V300AEQ ETF Units Elliott Wave technical forecast [Video]
![V300AEQ ETF Units Elliott Wave technical forecast [Video]](https://editorial.fxstreet.com/images/TechnicalAnalysis/ChartPatterns/Candlesticks/foreign-exchange-market-chart-24348895_XtraLarge.jpg)
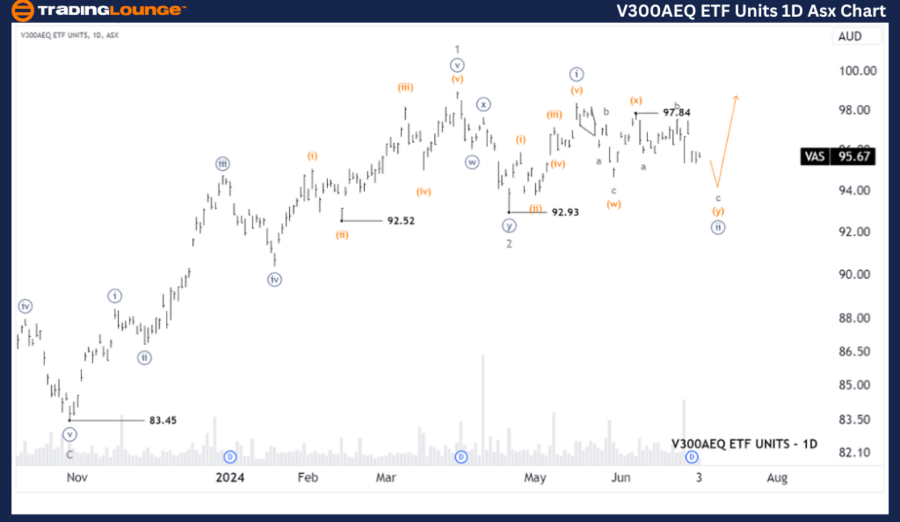
ASX: V300AEQ ETF UNITS – VAS Elliott Elliott Wave Technical Analysis TradingLounge (1D Chart)
Greetings, Our Elliott Wave analysis today updates the Australian Stock Exchange (ASX) with V300AEQ ETF UNITS – VAS. We see that wave 2-grey has ended and wave 3-grey is unfolding to push higher, subwaves are developing in the form of wave ((i)), and wave ((ii))-navy appears to be nearing completion, allowing wave ((iii))-navy to return to push higher later.
ASX: VAS Elliott Wave technical analysis
Function: Major trend (Minor degree, grey).
Mode: Motive.
Structure: Impulse.
Position: Wave c-grey of Wave (y)-orange of Wave ((ii))-navy.
Details: The short-term outlook shows that wave ((ii))-navy is lasting longer than expected, it is unfolding as a Double Zigzag, wave (y)-orange seems to be nearing completion, and will be followed by wave ((iii) ))-navy may return to push higher.
Invalidation point: 92.93.
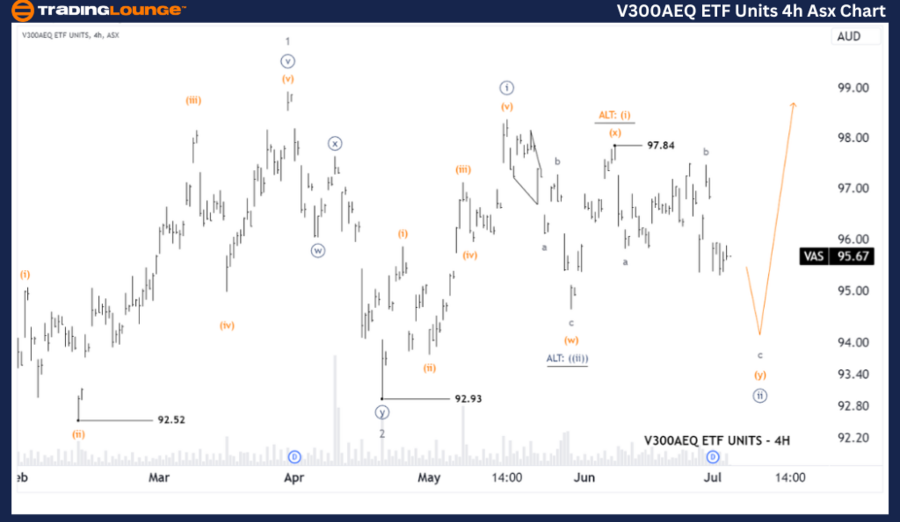
ASX: VAS four-hour chart analysis
Function: Major trend (Minute degree, navy).
Mode: Motive.
Structure: Impulse.
Position: Wave c-grey of Wave (y)-orange of Wave ((ii))-navy.
Details: The shorter-term outlook shows wave ((ii))-navy developing as a Double Zigzag, wave (y)-orange unfolding as an ABC Zigzag, waves a,b-grey completed, and wave c- gray seems to be fulfilling its role of continuing to push lower. After wave ((ii))-navy completes, wave ((iii))-navy will return to push even higher.
Invalidation point: 92.93.
Conclusion
Our analysis, forecast of contextual trends, and short-term outlook for ASX: V300AEQ ETF UNITS – VAS aim to provide readers with insights into the current market trends and how to capitalize on them effectively. We offer specific price points that act as validation or invalidation signals for our wave count, enhancing the confidence in our perspective. By combining these factors, we strive to offer readers the most objective and professional perspective on market trends.
V300AEQ ETF Units Elliott Wave technical forecast [Video]
Author

Peter Mathers
TradingLounge
Peter Mathers started actively trading in 1982. He began his career at Hoei and Shoin, a Japanese futures trading company.


