$UUUU: Uranium miner Energy Fuels reacts from weekly blue box
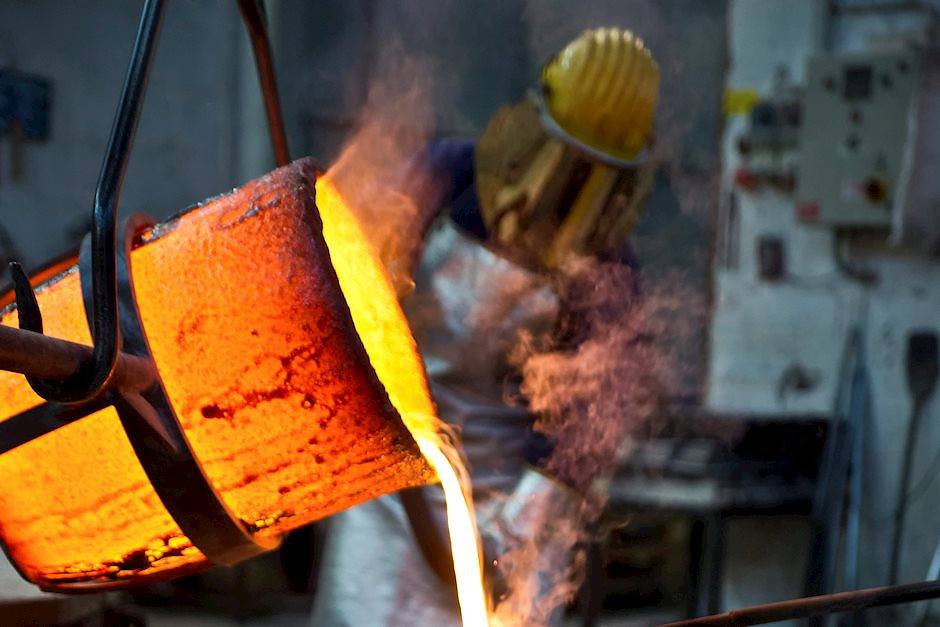
Energy Fuels is the largest US miner of the uranium. It produces the uranium both in form of triuranium octoxide and uranium hexafluoride. Besides the core business, the secondary products of Energy Fuels are rare earth elements and vanadium. Founded in 2006, the company has its headquarters in Lakewood, Colorado. One can trade it under the ticker $UUUU at the New York Stock Exchange. Investors in shares of the mining company are participating, therefore, in the company success story on the one hand and in the price development of the uranium commodity on the other.
Currently, we expect a new bullish cycle within the energy commodities like oil, gas, coal and others. Consequently, uranium should turn higher as well. Besides the market correlation in the energy group, the pattern of $UUUU shows a turn higher after 13 years of depressed prices in monthly charts as well. Moreover, weekly chart shows an initial nest from March 2020 ended and a new bullish leg in progress. In the current article, we discuss the pattern of Eneregy Fuels and provide with targets medium-to-long term.
Energy Fuels monthly Elliott Wave analysis 02.13.2023
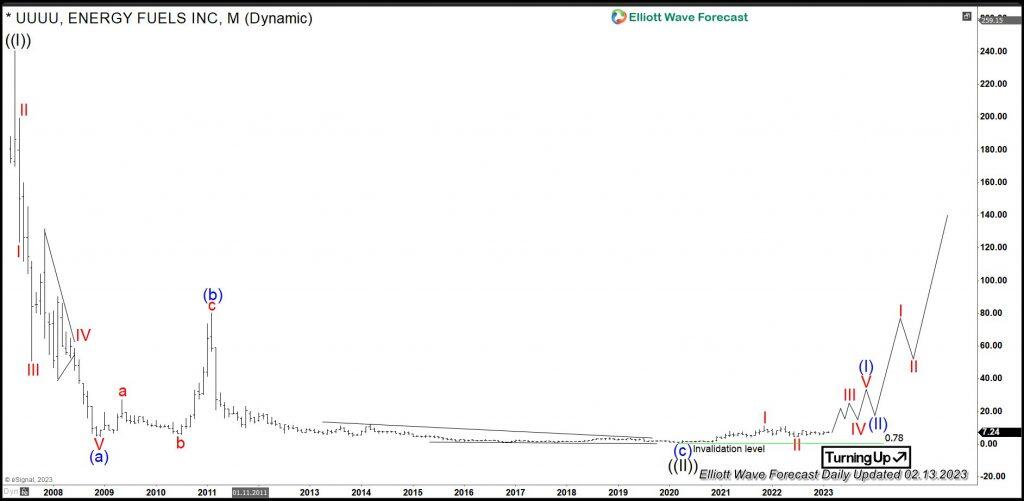
The Monthly chart below shows the Energy Fuels shares $UUUU traded at NYSE. First, the stock price has developed a cycle higher in black wave ((I)) of grand super cycle degree. It has printed the all-time highs on April 2007 at 240.61. From the highs, a correction lower in black wave ((II)) has unfolded as an Elliott wave zigzag pattern. It has printed an important bottom on March 2020 at 0.78.
From March 2020 lows, a new cycle in wave ((III)) has already started and should extend towards 240.61 highs and beyond. Then, the target for wave ((III)) will be towards 242.03-391.07 area and even higher.
Energy Fuels weekly Elliott Wave analysis 02.13.2023
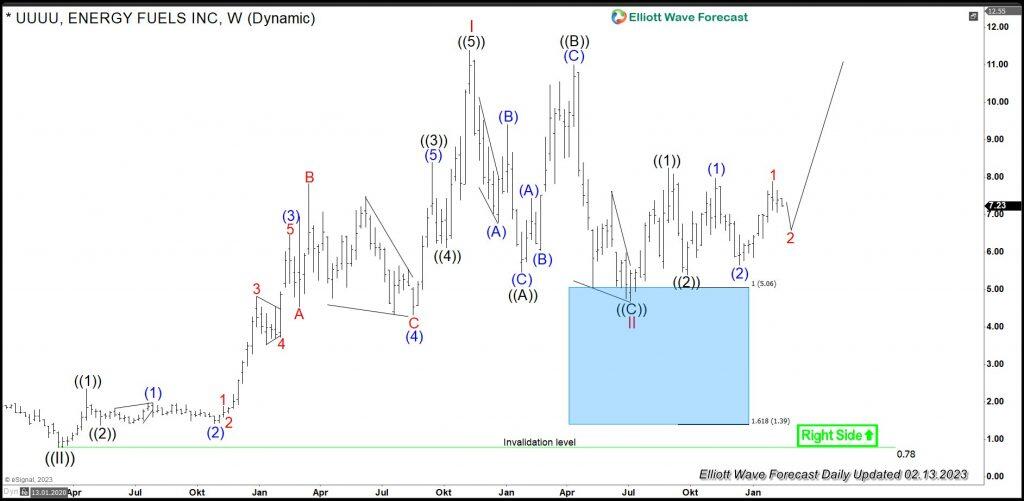
The Weekly chart below shows the $UUUU shares price action in more detail. The stock has ended the red waves I-II building a nest for the blue wave (I) of the black wave ((III)). First, the cycle higher from March 2020 in red wave I of blue wave (I) has ended in November 2021 at 11.39 highs. From the peak, a correction in wave II is has unfolded as a regular flat pattern being 3-3-5 structure. First, black wave ((A)) has ended in January 2022 at 5.46 lows. Then, a connector in black wave ((B)) has printed a lower high in April 2022 at 11.00. From there, wave ((C)) has broken 5.46 lows opening up a bearish sequence. Finally, it has reached the 5.06-1.39 blue box area. There, reaction higher is taking place. Now, while above July 2022 lows at 4.69, $UUUU might be in the initial stages of the red wave III. The target will be 15.34-21.91 and even higher. Investors and traders should stay long from 5.06-1.39 blue box area targeting 15.34-21.91 area in medium-term and 242.03-391.07 area in the long run.
Author

Elliott Wave Forecast Team
ElliottWave-Forecast.com


