|

Using RSI to identify Elliott Waves – Elliott Wave basics

If you’re new to Elliott Wave, you may be asking: How do I tell if a wave is over when there’s so much price movement? One tool, in addition to trendlines, is to use Relative Strength Index (RSI).

Relative strength index

The relative strength index (RSI) is a momentum indicator used in technical analysis. RSI measures the speed and magnitude of a security’s recent price changes to evaluate overvalued or undervalued conditions in the price of that security.

The RSI is displayed as an oscillator (a line graph) on a scale of zero to 100. The indicator was developed by J. Welles Wilder Jr. and introduced in his seminal 1978 book, New Concepts in Technical Trading Systems.

The RSI can do more than point to overbought and oversold securities. It can also indicate securities that may be primed for a trend reversal or corrective pullback in price. It can signal when to buy and sell. Traditionally, an RSI reading of 70 or above indicates an overbought situation. A reading of 30 or below indicates an oversold condition.

Here is what RSI looks like:

Chart

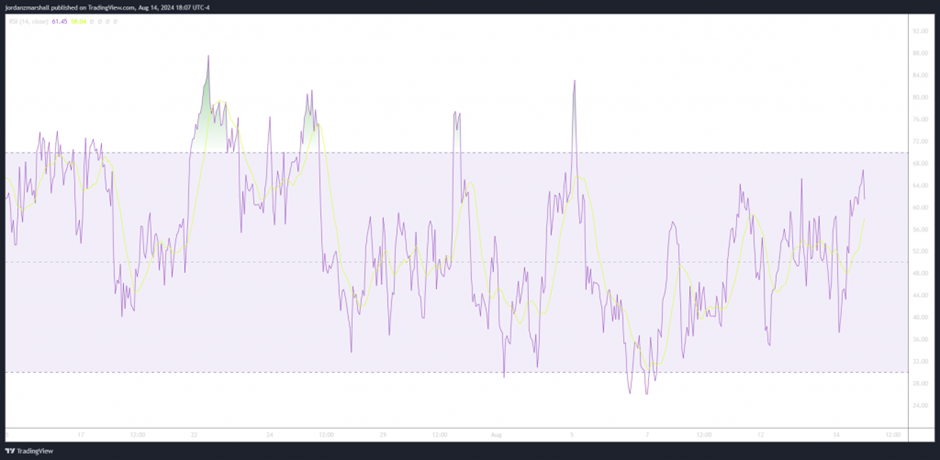
RSI swinging from 70 and 30

​How to use RSI

We can use RSI’s movements up and down to identify waves by paying attention to the trends within it like so:

Chart

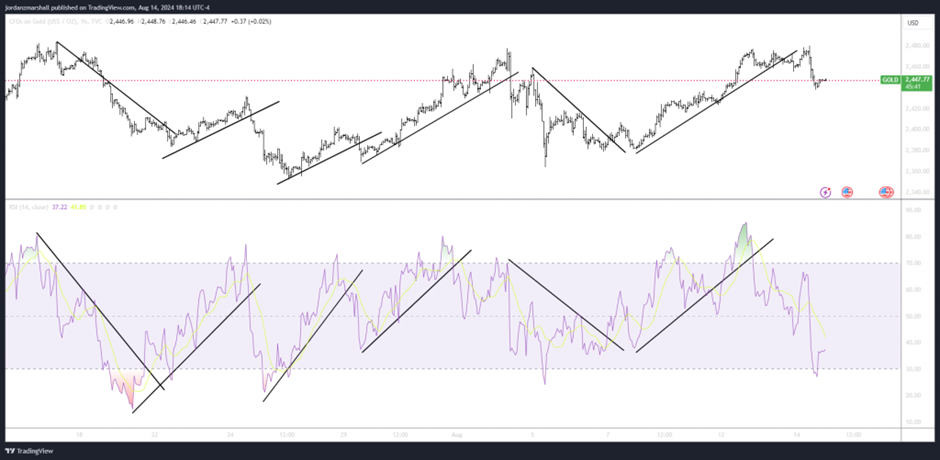
Waves moving with RSI

Clearly, in the above picture, you can see how RSI trends with price, and even proceeds it when breaking trend lines. You may be able to use these trend lines to tell when one wave ends and another begins. The key here is to draw your lines off of as many supporting lows as you can. Most lines here have 2-3 tests and encompass an entire downtrend. RSI trends are composed on higher highs, and higher lows, but downtrends are composed of lower lows, and lower highs.

Author

Elliott Wave Forecast Team

Elliott Wave Forecast Team

ElliottWave-Forecast.com

More from Elliott Wave Forecast Team
Share:

Editor's Picks

EUR/USD climbs to two-week highs beyond 1.1900

EUR/USD is keeping its foot on the gas at the start of the week, reclaiming the 1.1900 barrier and above on Monday. The US Dollar remains on the back foot, with traders reluctant to step in ahead of Wednesday’s key January jobs report, allowing the pair to extend its upward grind for now.

GBP/USD hits three-day peaks, targets 1.3700

GBP/USD is clocking decent gains at the start of the week, advancing to three-day highs near 1.3670 and building on Friday’s solid performance. The better tone in the British Pound comes on the back of the intense sekk-off in the Greenback and despite re-emerging signs of a fresh government crisis in the UK.

Gold treads water around $5,000

Gold is trading in an inconclusive fashion around the key $5,000 mark on Monday week. Support is coming from fresh signs of further buying from the PBoC, while expectations that the Fed could turn more dovish, alongside concerns over its independence, keep the demand for the precious metal running.

Crypto Today: Bitcoin steadies around $70,000, Ethereum and XRP remain under pressure 

Bitcoin hovers around $70,000, up near 15% from last week's low of $60,000 despite low retail demand. Ethereum delicately holds $2,000 support as weak technicals weigh amid declining futures Open Interest. XRP seeks support above $1.40 after facing rejection at $1.54 during the previous week's sharp rebound.

Japanese PM Takaichi nabs unprecedented victory – US data eyed this week

I do not think I would be exaggerating to say that Japanese Prime Minister Sanae Takaichi’s snap general election gamble paid off over the weekend – and then some. This secured the Liberal Democratic Party (LDP) an unprecedented mandate just three months into her tenure.

Ripple exposed to volatility amid low retail interest, modest fund inflows

Ripple (XRP) is extending its intraday decline to around $1.40 at the time of writing on Monday amid growing pressure from the retail market and risk-off sentiment that continues to keep investors on the sidelines.