USDJPY Price Analysis: Bulls attempting to break key hourly resistance structure
- USDJPY bulls are testing bearish commitments below 140.80 resistance and above 139.50 support.
- Bulls eye a break to 142.00 and 143.00 beyond there for the days ahead.

USDJPY is under some slight pressure as the Asian session moves along, now printing in the red for the day so far. The price has traveled from a high of 140.49 to a low of 140.01 so far.
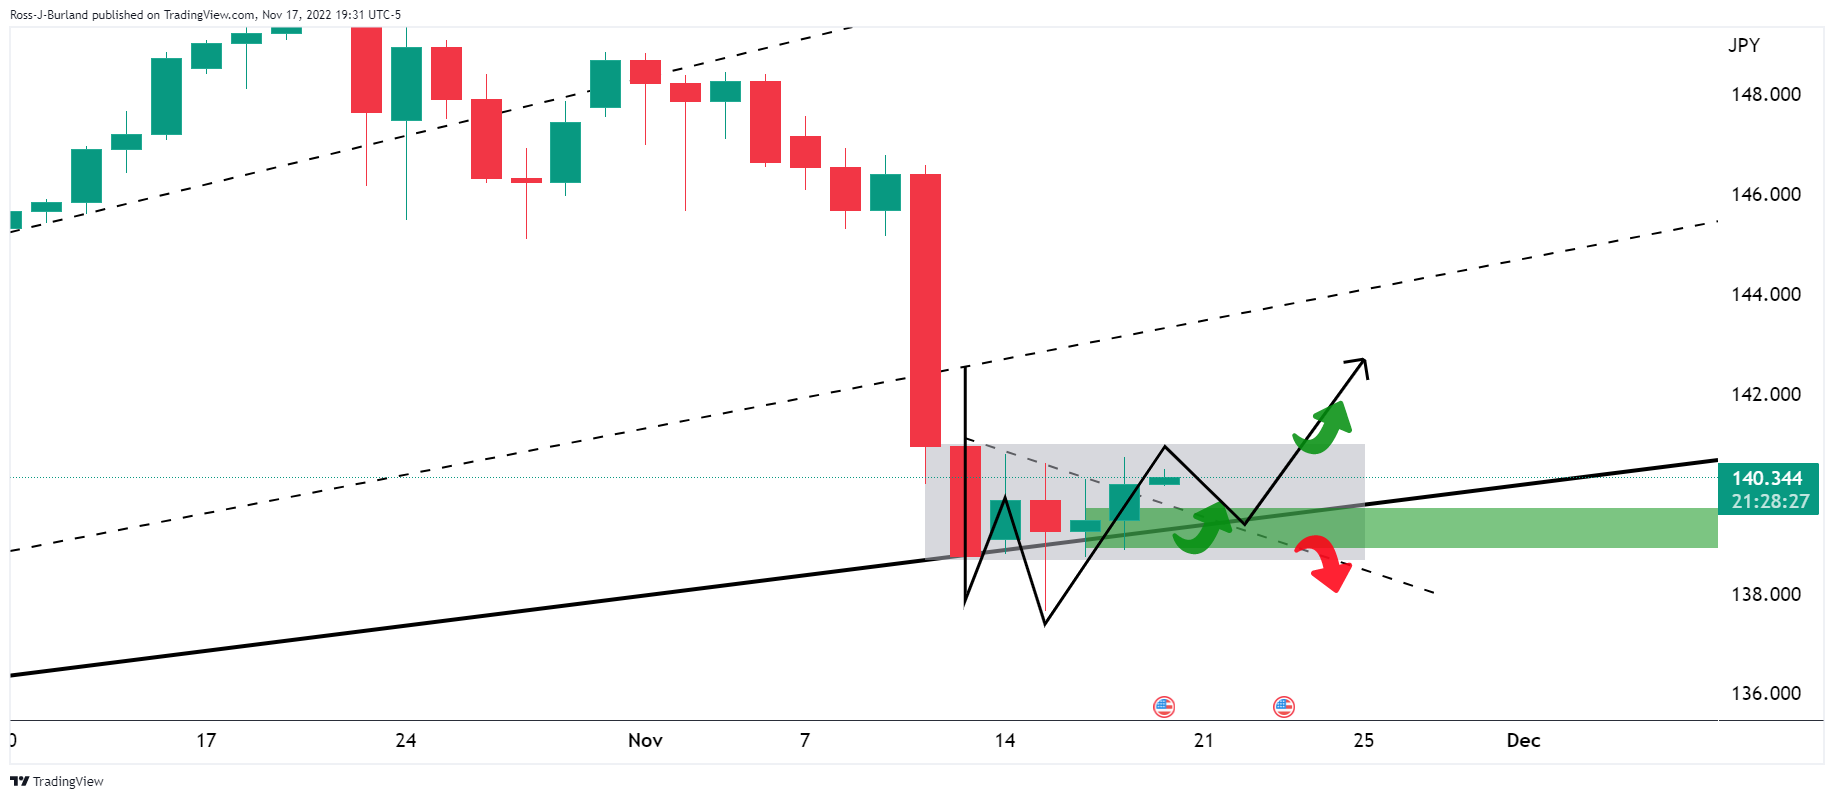
The US Dollar index DXY is however stabilizing after a small miss on US inflation last week that was negated by hawkish comments from some Federal Reserve officials arguing one report will not be the grounds for a pivot. The price is boxed in but a breakout could be on the cards immanently, one way or the other. The following illustrates a bullish bias so long as the trendline and horizontal support between 139.00/50 holds:
USDJPY daily chart

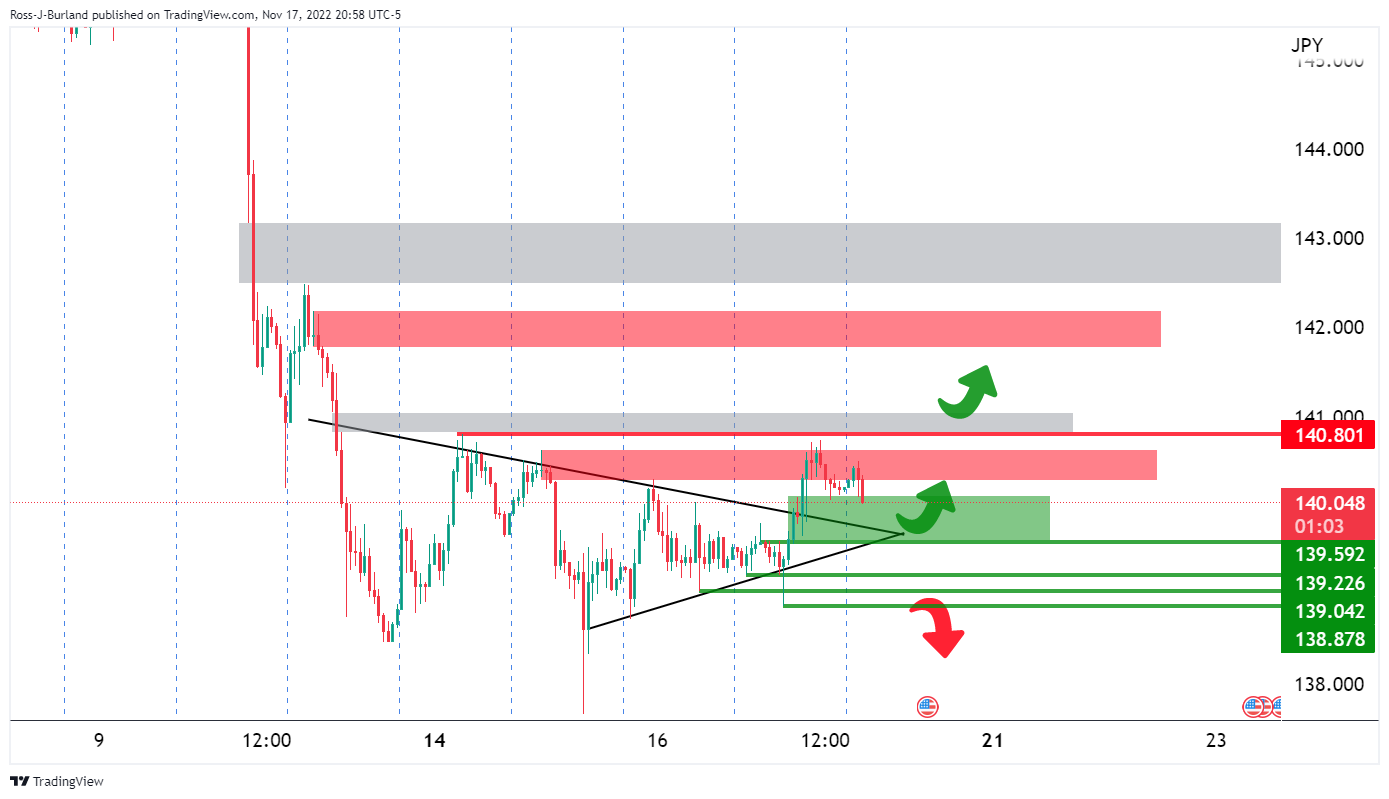
USDJPY H1 chart
The price is boxed in but a breakout could be on the cards with the market already through prior hourly structures and now needing to reply on bullish commitments above 139.50 for a run through 140.80 resistance that guards room to 142.00 and then 143.00:
Author

Ross J Burland
FXStreet
Ross J Burland, born in England, UK, is a sportsman at heart. He played Rugby and Judo for his county, Kent and the South East of England Rugby team.


