USD/ZAR Price Analysis: South African Rand bounces off 10-DMA to aim for fresh record high


  • USD/ZAR steadies above short-term moving average, pauses the previous pullback from all-time high.
  • RSI conditions suggest pullback in prices but previous resistance line from October 2022 holds gate for South African Rand buyers.
  • Week-long resistance line restricts USD/ZAR run-up towards 20.00.

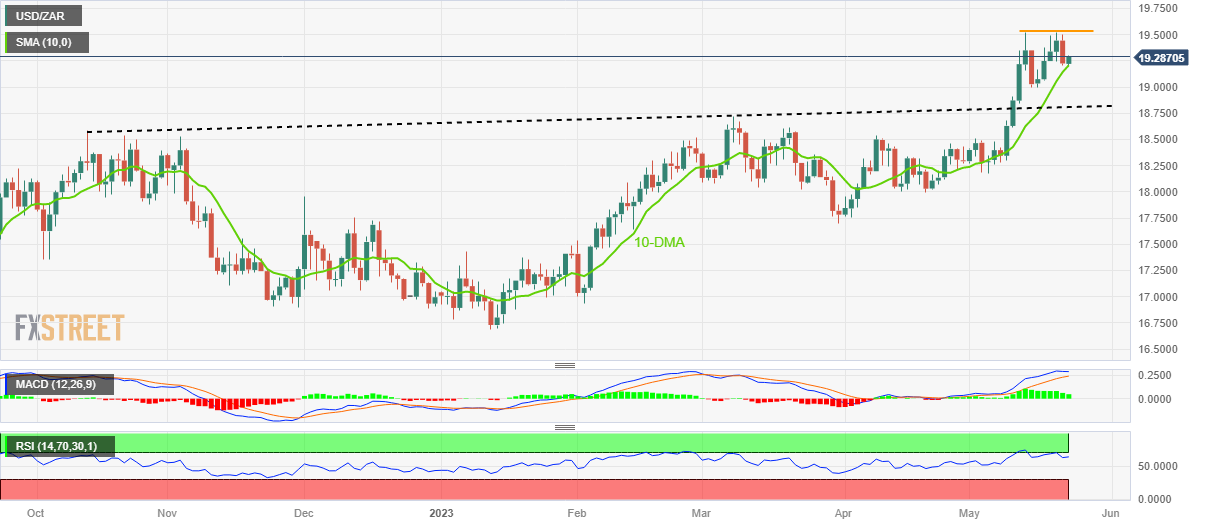
USD/ZAR picks up bids to reverse the previous day’s pullback from the all-time high as buyers prod the 19.26 level heading into Tuesday’s European session.

In doing so, the South African Rand (ZAR) reverses from the 10-DMA. Given the bullish MACD signals the pair is likely to extend the latest recovery towards an upward-sloping resistance line connecting the latest peaks, which are also the record high, close to 19.53.

However, the nearly overbought RSI conditions, as well as the oscillator’s inability to march the higher-high in prices, signals another pullback from the stated resistance line.

Failing to do so can gradually propel the USD/ZAR prices toward the 20.00 round figure.

On the contrary, a downside break of the 10-DMA level of around 19.20 can quickly drag the South African Rand price to the 19.00 round figure.

Though, an upward-sloping previous resistance line from October 2022, now the key support near 18.80, holds the gate for the ZAR bulls afterward.

Overall, USD/ZAR remains on the bull’s radar but the upside room appears limited.

USD/ZAR: Daily chart

Trend: Further upside expected

Additional important levels

Overview
Today last price 19.2448
Today Daily Change 0.0202
Today Daily Change % 0.11
Today daily open 19.2246
 
Trends
Daily SMA20 18.7478
Daily SMA50 18.4148
Daily SMA100 18.0304
Daily SMA200 17.7715
 
Levels
Previous Daily High 19.5032
Previous Daily Low 19.206
Previous Weekly High 19.525
Previous Weekly Low 18.9943
Previous Monthly High 18.5399
Previous Monthly Low 17.7526
Daily Fibonacci 38.2% 19.3195
Daily Fibonacci 61.8% 19.3896
Daily Pivot Point S1 19.1193
Daily Pivot Point S2 19.0141
Daily Pivot Point S3 18.8222
Daily Pivot Point R1 19.4165
Daily Pivot Point R2 19.6084
Daily Pivot Point R3 19.7136


Share: Feed news

Information on these pages contains forward-looking statements that involve risks and uncertainties. Markets and instruments profiled on this page are for informational purposes only and should not in any way come across as a recommendation to buy or sell in these assets. You should do your own thorough research before making any investment decisions. FXStreet does not in any way guarantee that this information is free from mistakes, errors, or material misstatements. It also does not guarantee that this information is of a timely nature. Investing in Open Markets involves a great deal of risk, including the loss of all or a portion of your investment, as well as emotional distress. All risks, losses and costs associated with investing, including total loss of principal, are your responsibility. The views and opinions expressed in this article are those of the authors and do not necessarily reflect the official policy or position of FXStreet nor its advertisers. The author will not be held responsible for information that is found at the end of links posted on this page.

If not otherwise explicitly mentioned in the body of the article, at the time of writing, the author has no position in any stock mentioned in this article and no business relationship with any company mentioned. The author has not received compensation for writing this article, other than from FXStreet.

FXStreet and the author do not provide personalized recommendations. The author makes no representations as to the accuracy, completeness, or suitability of this information. FXStreet and the author will not be liable for any errors, omissions or any losses, injuries or damages arising from this information and its display or use. Errors and omissions excepted.

The author and FXStreet are not registered investment advisors and nothing in this article is intended to be investment advice.

Recommended content


Recommended content

Editors’ Picks

EUR/USD climbs above 1.0900, looks to post weekly gains

EUR/USD climbs above 1.0900, looks to post weekly gains

EUR/USD gathers bullish momentum and trades above 1.0900 in the American session on Friday, looking to end the week in positive territory. The US Dollar remains under strong selling pressure following the disappointing jobs data, helping the pair push higher.

EUR/USD News

GBP/USD clings to daily gains near 1.2800 after weak US jobs data

GBP/USD clings to daily gains near 1.2800 after weak US jobs data

GBP/USD clings to daily gains at around 1.2800 in the second half of the day on Friday. Nonfarm Payrolls in the US rose by 114,000 in July. This reading missed the market expectation of 175,000 by a wide margin and triggered a USD selloff.

GBP/USD News

Gold pulls away from daily highs, holds above $2,420

Gold pulls away from daily highs, holds above $2,420

After coming within a touching distance of a new all-time high near $2,480 with the immediate reaction to disappointing US labor market data on Friday, Gold reversed its direction and declined below $2,420. Profit-taking ahead of the weekend might be weighing on XAU/USD.

Gold News

Bitcoin bounces off from the ascending trendline

Bitcoin bounces off from the ascending trendline

Bitcoin and Ethereum have retested their key support levels, with a break below these levels potentially signaling a bearish trend ahead. At the same time, Ripple shows resilience and could rally in the coming days after testing its key support level.

Read more

Week ahead – RBA and BoJ summary of opinions take center stage

Week ahead – RBA and BoJ summary of opinions take center stage

RBA decides on policy as hike bets disappear. BoJ Summary of Opinions awaited for more hike hints. After Fed, Dollar turns to ISM non-manufacturing PMI. New Zealand and Canada jobs data also on tap.

Read more

Forex MAJORS

Cryptocurrencies

Signatures