USD/TRY Price Analysis: Stays on the way to 15.00
- USD/TRY holds onto the previous week’s rebound from 10-DMA.
- MACD conditions portray buyers losing momentum inside short-term rising wedge bearish chart pattern.
- Multiple supports, fundamental catalysts keep buyers hopeful around one-week high.
USD/TRY grinds higher around 14.85 during Tuesday’s Asian session.
In doing so, the Turkish lira (TRY) pair extends the last week’s U-turn from the 10-DMA inside a one-month-old rising wedge bearish chart pattern. Also teasing USD/TRY sellers is the receding bullish bias of the MACD.
However, multiple failures to break the 10-DMA and strong fundamentals supporting the USD growth, as well as weighing on the TRY, keep USD/TRY bulls hopeful.
That said, the current upside eyes the 15.00 threshold ahead of the monthly peak of 15.06.
In a case where USD/TRY bulls keep reins past 15.06, the upper line of the stated wedge, near 15.30 will be in focus.
Alternatively, the 10-DMA level of 14.75 restricts the immediate downside of the pair ahead of the wedge’s support line, close to 14.70 at the latest.
Should the USD/TRY prices drop below 14.70, the bearish formation suggesting a south-run towards February’s low surrounding 13.25 can’t be ruled out. Though, the 14.00 round figure and the monthly bottom near 13.75 will challenge the bears on the way.
USD/TRY: Daily chart
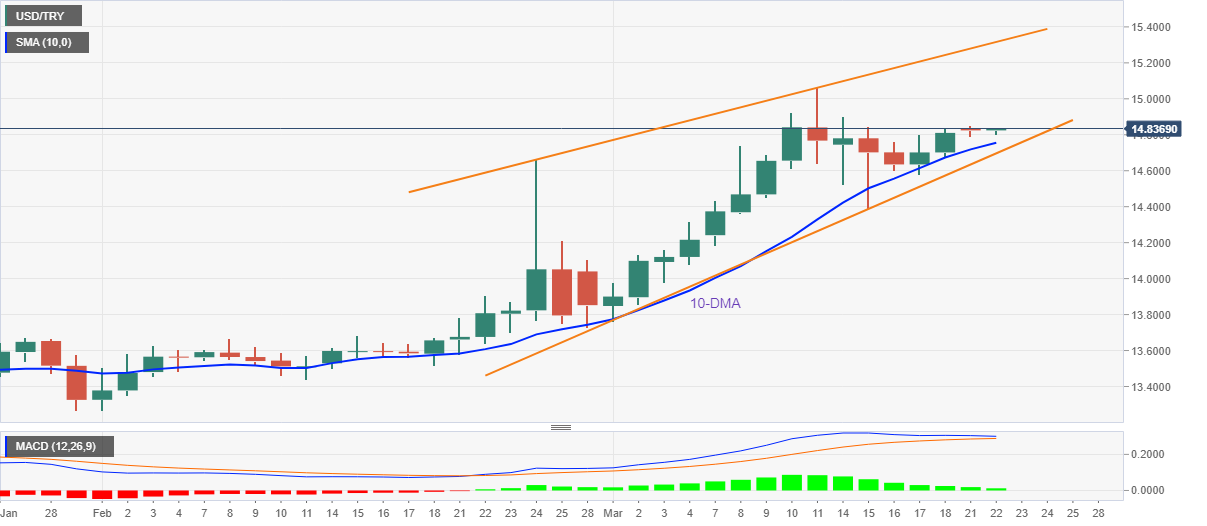
Trend: Bullish
Author

Anil Panchal
FXStreet
Anil Panchal has nearly 15 years of experience in tracking financial markets. With a keen interest in macroeconomics, Anil aptly tracks global news/updates and stays well-informed about the global financial moves and their implications.


