USD/TRY Price Analysis: Bulls keep eyes on $12.70 hurdle
- USD/TRY holds onto Friday’s recovery moves above short-term support line.
- MACD teases bulls as the quote heads to weekly horizontal resistance.
- 61.8% Fibonacci retracement limits immediate declines below October’s high.
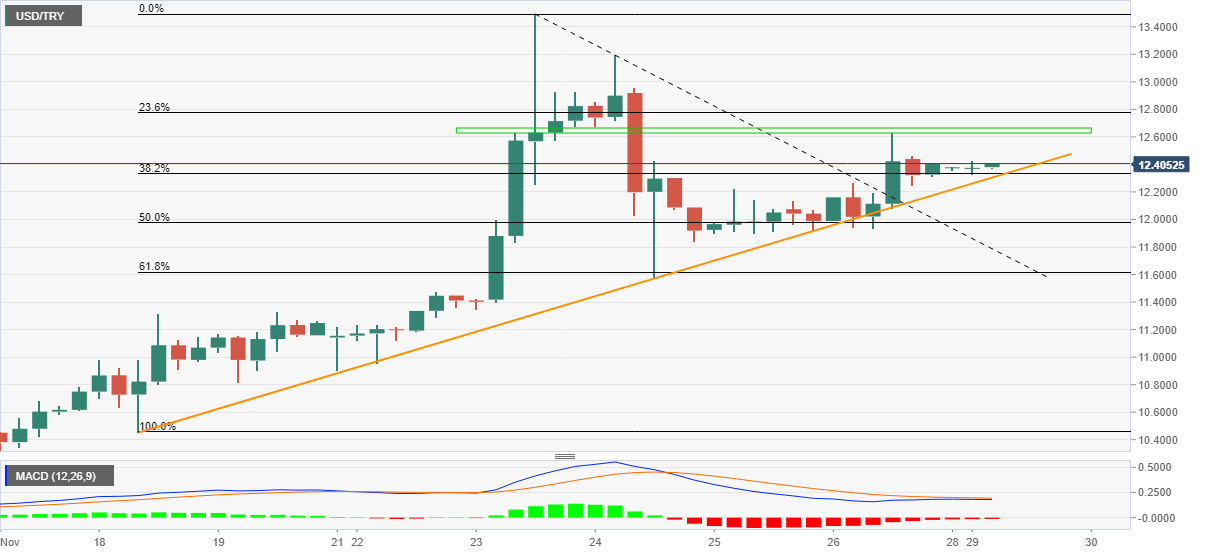
USD/TRY remains range-bound near $12.40 heading into Monday’s European session.
The Turkish lira (TRY) pair snapped a two-day downtrend the previous day while staying past a weekly ascending support line.
Given the MACD line teasing bullish cross, as the quote remains above the short-term rising support line, USD/TRY buyers are likely to aim for the one-week-old horizontal resistance near $12.70.
Following that, the $13.00 threshold may offer an intermediate halt during the run-up to the recently flashed record top of $13.49.
Meanwhile, a downside break of the aforementioned support line near $12.30 will aim for a 50% Fibonacci retracement (Fibo.) level of the November 18-23 rally, around $12.00.
During the USD/TRY weakness below the $12.00 threshold, the previous resistance line from November 23 and 61.8% Fibo., respectively around $11.80 and $11.60, will challenge the bears before October’s peak of $9.85.
USD/TRY: Four-hour chart
Trend: Further upside expected
Author

Anil Panchal
FXStreet
Anil Panchal has nearly 15 years of experience in tracking financial markets. With a keen interest in macroeconomics, Anil aptly tracks global news/updates and stays well-informed about the global financial moves and their implications.


