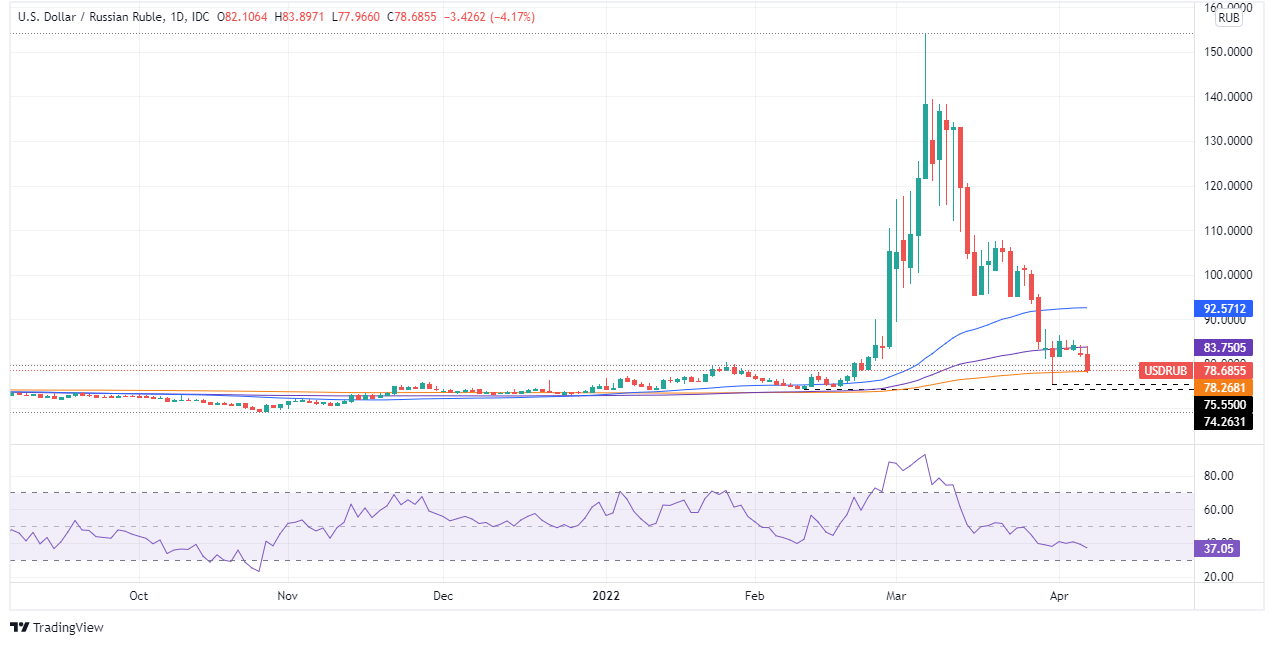
USD/RUB recovers and goes back above the 200-DMA as sellers eye 78.0000
- The Russian ruble keeps strengthening vs. the greenback, as the USD/RUB falls 4.17%.
- Risk-aversion, and the further duration of the Ukraine-Russia war, weigh on the market mood.
- USD/RUB Price Forecast: Upward biased, but downside risks remain as it is probing the 200-DMA.
The Russian ruble keeps rallying vs. the greenback and is pushing through the 200-DMA as portrayed by the USD/RUB pair, which is falling 4.20% during the North American session amidst a dismal market mood. At the time of writing, the USD/RUB is trading at 78.6855.
In the North American session, the sentiment turned sour. The Ukraine/Russia war continues to weigh on sentiment, as Ukraine’s President Zelenskiy will meet EU Commission President von der Leyen, on Friday in Kyiv. Meanwhile, Moscow said that the US sending weapons to Ukraine does not contribute to peace talks and added that it would retaliate against current sanctions.
Elsewhere on Wednesday, the Federal Reserve revealed its March minutes. The central bank said that most participants were eager to hike rates 50 bps if not for Ukraine. The Fed agreed to cap its balance sheet by an amount of $95 billion, $60 billion on US Treasuries, and $35 billion on mortgage-backed securities (MBS).
The FOMC added that participants expect the Quantitative Tightening to begin by May, following the May 4 meeting, where market participants, as shown by STIRS, are pricing in an 80% chance of a 50 bps hike.
Meanwhile, the US Dollar Index, a gauge of the greenback’s measure against a basket of its rivals, retreats from YTD highs, down 0.04%, sitting at 99.586. Contrarily, the US Treasury yields are rising, as depicted by the 10-year benchmark note sitting at 2.652%, gaining five basis points, reflecting the aggressive tightening of the Fed.
USD/RUB Price Forecast: Technical outlook
The USD/RUB upward bias is being tested, as the price is probing the 200-day moving average (DMA) at 78.2696. On Wednesday, I noted that “a daily close under the 80.3254 level would further extend losses, and the USD/RUB could aim toward the 200-day moving average (DMA).” On Thursday, that is happening, and a break could pave the way towards February 11 swing low at 74.2631.
That said, the USD/RUB first support would be 78.0000. A breach of the latter would expose March 31, a daily low at 75.5500, followed by the February 11 swing low at 74.2631.
Upwards, the USD/RUB first resistance would be 82.7882. Breach of the latter would expose essential resistance levels. The next supply zone would be 85.00, followed by the 50-DMA at 88.7789.
Author

Christian Borjon Valencia
FXStreet
Markets analyst, news editor, and trading instructor with over 14 years of experience across FX, commodities, US equity indices, and global macro markets.


