USD/RUB Price Analysis: Prints a YTD high at 117.68 though RSI’s negative divergence in the H1 chart looms
- The ruble depreciated 44% in the last two days, weighed by the Russia – Ukraine conflict.
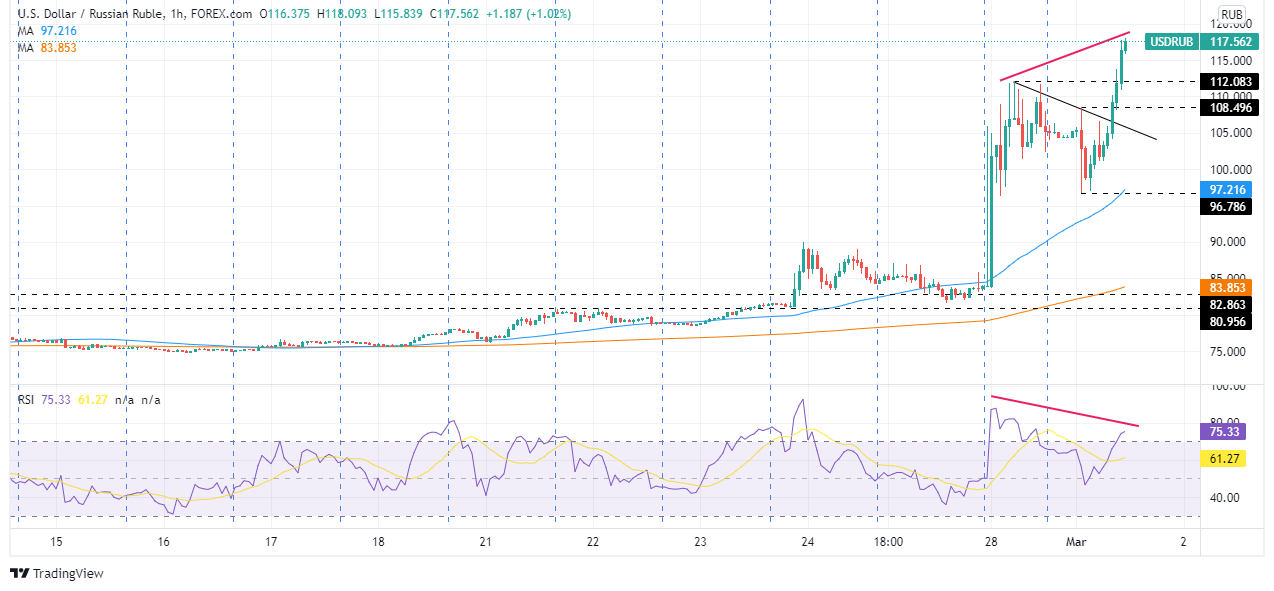
- On Tuesday, the USD/RUB prints a YTD high at 118.09.
- USD/RUB Technical Outlook: It is upward biased, though a negative divergence in the 1-hour chart looms, spurring an opportunity to dip buyers.
The USD/RUB skyrockets for the second straight day, as geopolitical tensions between Russia and Ukraine do not subside, while the USD/RUB reached a YTD high at 118.09. At the time of writing, the USD/RUB is trading at 117.75.
From a technical perspective, it is easy to spot that the USD/RUB is upward biased. The daily moving averages are below the 78.00 mark, and the USD/RUB sits above February 28 daily high at 111.67.
Therefore, it is suggested to approach USD/RUB price action from the 1-hour chart due to the strong uptrend and volatility of the markets. Caution is warranted.
USD/RUB Price Forecast: Technical outlook
USD/RUB 1-hour chart shows that the USD/RUB depreciated 32% in the day on Monday. However, the pair traded in the 96.00-112.08 range, for some time, before breaking upwards, reaching a high at 116.76. However, the Relative Strength Index (RSI) is at overbought levels at 74.82, aiming higher. Therefore, if the USD/RUB stabilizes around the 112.08-116.76 range, it could print a new lower high that could portray a negative divergence between price action and the RSI. Such a divergence could spur a move downwards.
If that event plays out, USD/RUB first support would be 108.49. Breach of the latter would expose a downslope trendline, which passes around 105.00, followed by the confluence of the 50-hour simple moving average (SMA) and March 1 daily low at 96.78.
Author

Christian Borjon Valencia
FXStreet
Markets analyst, news editor, and trading instructor with over 14 years of experience across FX, commodities, US equity indices, and global macro markets.


