|

USD/NOK falls below the 20-day SMA driven by USD’s weakness

  • USD/NOK fell below the 20-day SMA towards the 10.6150 area.
  • Norwegian CPI from August came in soft.
  • Investors await US inflation figures on Wednesday.

At the start of the week, the USD/NOK lost the 20-day Simple Moving Average (SMA) near 10.6150 and then settled around 10.6470. Despite Norway reporting soft inflation data, the pair movements are explained by a US Dollar (USD), which is experiencing weakness across the board.

After last week’s sharp gains, the NOK is tallying losses against most of its rivals, including the USD, JPY, EUR and GBP, and investors seem to be taking profits. No relevant data will be released during the session, and all eyes are on Wednesday’s US Consumer Price Index (CPI) from August, which is expected to have accelerated. Regarding expectations on the Federal Reserve (Fed), markets already priced in a pause in next week’s meeting. However, the odds of one last hike remain high in November and December, according to the CME FedWatch tool.

On the NOK’s side, August’s CPI from Norway came in at 4.8% YoY, lower than the expected and previous figure of 5.4%. The Norges Bank stated in its last meeting that it still has more ground to cover and will likely hike at the September meeting and a hawkish stance may provide further cushioning to the Norwegian currency.

USD/NOK Levels to watch 

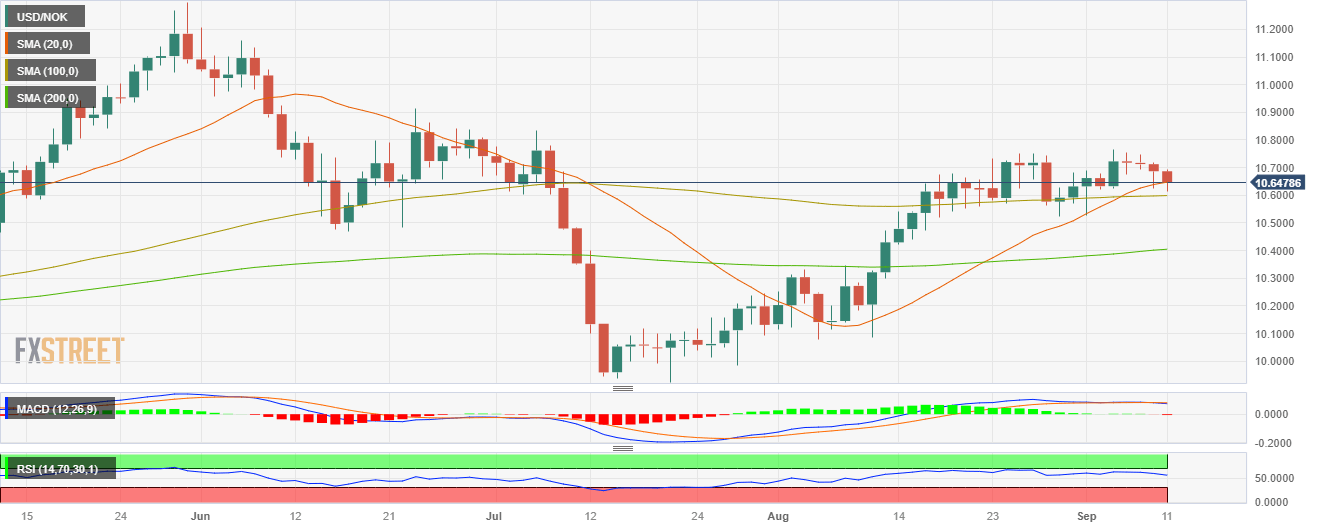
Analysing the daily chart, it is apparent that the USD/NOK has a neutral to bearish technical stance, with the bears gradually recovering. The Relative Strength Index (RSI) points downwards in the bullish territory, suggesting a possible trend reversal, while the Moving Average Convergence (MACD) histogram presents rising red bars. Moreover, the pair is below the 20-day Simple Moving Average (SMA), but above the 100 and 200-day SMAs, indicating that the buyers still hold momentum on the bigger picture, dominating the sellers.

 Support levels: 10.5900 (100-day SMA), 10.5000, 10.4000 (200-day SMA).

 Resistance levels: 10.6500 (20-day SMA), 10.7000, 10.7500.

USD/NOK Daily Chart

USD/NOK

Overview
Today last price10.6476
Today Daily Change-0.0394
Today Daily Change %-0.37
Today daily open10.687
 
Trends
Daily SMA2010.6391
Daily SMA5010.4105
Daily SMA10010.5977
Daily SMA20010.4017
 
Levels
Previous Daily High10.7194
Previous Daily Low10.6258
Previous Weekly High10.7652
Previous Weekly Low10.6215
Previous Monthly High10.7518
Previous Monthly Low10.0804
Daily Fibonacci 38.2%10.6615
Daily Fibonacci 61.8%10.6837
Daily Pivot Point S110.6353
Daily Pivot Point S210.5837
Daily Pivot Point S310.5416
Daily Pivot Point R110.729
Daily Pivot Point R210.7711
Daily Pivot Point R310.8227

Author

Patricio Martín

Patricio is an economist from Argentina passionate about global finance and understanding the daily movements of the markets.

More from Patricio Martín
Share:

Editor's Picks

EUR/USD flirts with daily highs, retargets 1.1900

EUR/USD regains upside traction, returning to the 1.1880 zone and refocusing its attention to the key 1.1900 barrier. The pair’s slight gains comes against the backdrop of a humble decline in the US Dollar as investors continue to assess the latest US CPI readings and the potential Fed’s rate path.

GBP/USD remains well bid around 1.3650

GBP/USD maintains its upside momentum in place, hovering around daily highs near 1.3650 and setting aside part of the recent three-day drop. Cable’s improved sentiment comes on the back of the Greenback’s  irresolute price action, while recent hawkish comments from the BoE’s Pill also collaborate with the uptick.

Gold clings to gains just above $5,000/oz

Gold is reclaiming part of the ground lost on Wednesday’s marked decline, as bargain-hunters keep piling up and lifting prices past the key $5,000 per troy ounce. The precious metal’s move higher is also underpinned by the slight pullback in the US Dollar and declining US Treasury yields across the curve.

Crypto Today: Bitcoin, Ethereum, XRP in choppy price action, weighed down by falling institutional interest 

Bitcoin's upside remains largely constrained amid weak technicals and declining institutional interest. Ethereum trades sideways above $1,900 support with the upside capped below $2,000 amid ETF outflows.

Week ahead – Data blitz, Fed Minutes and RBNZ decision in the spotlight

US GDP and PCE inflation are main highlights, plus the Fed minutes. UK and Japan have busy calendars too with focus on CPI. Flash PMIs for February will also be doing the rounds. RBNZ meets, is unlikely to follow RBA’s hawkish path.

Ripple Price Forecast: XRP potential bottom could be in sight

Ripple edges up above the intraday low of $1.35 at the time of writing on Friday amid mixed price actions across the crypto market. The remittance token failed to hold support at $1.40 the previous day, reflecting risk-off sentiment amid a decline in retail and institutional sentiment.