USD/MXN Technical Analysis: Short-term broadening wedge, risks titled to the downside
- The Mexican peso outperformed today after financial markets have positively received the 2019 budget.
- The USD/MXN is moving in a broadening wedge in the short-term, at the moment with a bearish bias that could point to a test of the lower limit. A consolidation significantly below 19.95 would open the doors to an extension of the bearish correction, targeting 19.60/70.
- To the upside, resistance levels are seen at 20.40 and then 20.70. A close above the last one would expose 2018 highs at 20.95/21.00.

USD/MXN 4-hour chart
-636806752959614998.png)
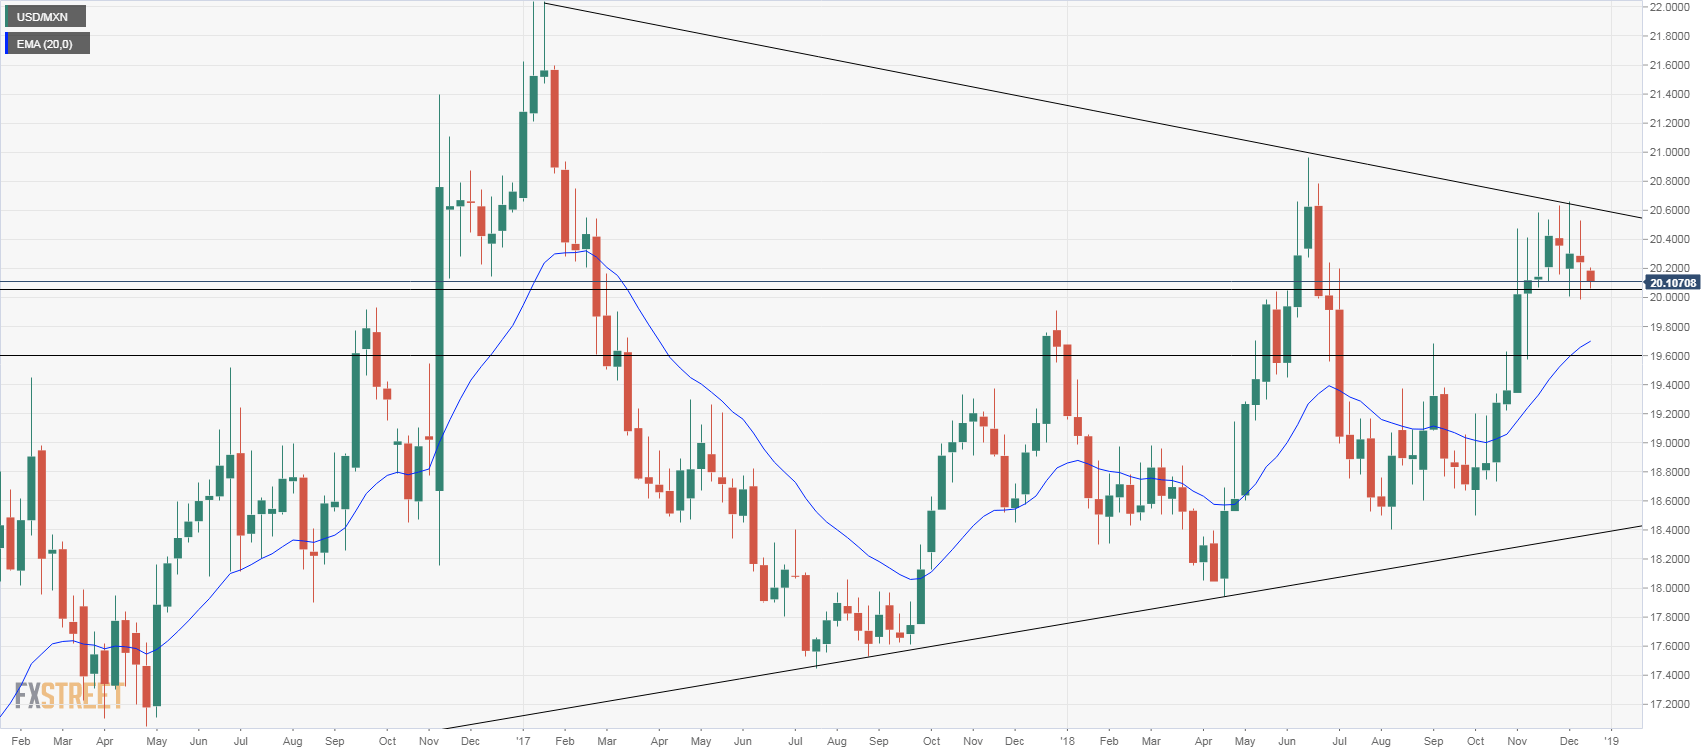
USD/MXN Weekly chart
USD/MXN
Overview:
Today Last Price: 20.1106
Today Daily change %: -0.651%
Today Daily Open: 20.2423
Trends:
Previous Daily SMA20: 20.3407
Previous Daily SMA50: 19.9191
Previous Daily SMA100: 19.4117
Previous Daily SMA200: 19.3054
Levels:
Previous Daily High: 20.5312
Previous Daily Low: 20.1981
Previous Weekly High: 20.5312
Previous Weekly Low: 19.9874
Previous Monthly High: 20.6355
Previous Monthly Low: 19.576
Previous Daily Fibonacci 38.2%: 20.3254
Previous Daily Fibonacci 61.8%: 20.404
Previous Daily Pivot Point S1: 20.1165
Previous Daily Pivot Point S2: 19.9907
Previous Daily Pivot Point S3: 19.7834
Previous Daily Pivot Point R1: 20.4497
Previous Daily Pivot Point R2: 20.657
Previous Daily Pivot Point R3: 20.7828
Author

Matías Salord
FXStreet
Matías started in financial markets in 2008, after graduating in Economics. He was trained in chart analysis and then became an educator. He also studied Journalism. He started writing analyses for specialized websites before joining FXStreet.


