USD/MXN slumps to yearly low as USD weakens on soft US Retail Sales
- USD/MXN sinks to a fresh yearly low of 16.7181 amid weaker-than-expected US Retail Sales and industrial production figures.
- Greenback defensive as US Dollar Index slips 0.07%; US Treasury bond yields also experience a dip.
- Market awaits Mexican Retail Sales data; a risk of ‘hard landing’ in the US may impact emerging market currencies.

USD/MXN tumbled to fresh yearly lows of 17.6899 early in the North American session after the greenback (USD) softened amidst the US Department of Commerce revealed June’s Retail Sales report. The USD/MXN is trading at 16.7181, with losses of 0.03%.
Weak US Industrial Production and Retail Sales boosted the Mexican Peso
Key economic data revealed before Wall Street opened exacerbated the USD/MXN’s fall toward new yearly lows. US Retail Sales for June rose by 0.2% MoM, below estimates of 0.5%, while excluding autos, the so-called core Retail Sales missed the 0.3% forecasts and jumped by a modest 0.2% MoM. In other data revealed by the US Federal Reserve (Fed), industrial Production tanked, with monthly figures sliding -0.5% MoM, below estimates of 0%. At the same time, annually based, market participants projected a 1.1% expansion, though data plunged -0.4 percent in data revealed from June.
Following the data release, the USD/MXN continued to trend lower while the buck remained defensive. The US Dollar Index (DXY), a gauge of the US Dollar against a basket of peers, stands at 99.817, down 0.07%.
US Treasury bond yields dropped as the US 2-year Treasury note yields 4.715%, three basis points below its opening price. The 10-year benchmark note sits at 3.760% and slides five basis points.
The agenda in Mexico remained empty, with Retail Sales expected to be released on Thursday. Annually figures for May are expected to decelerate from 3.8% to 3.5%, while for monthly numbers, analysts foresee a deeper slowdown to 0.3% from April’s 1.5%.
Given the backdrop, the USD/MXN bias remains tilted downwards, though the overextended fall could find some support at around the 16.30/50 area if the current YTD low is broken. The interest rate differential favors the Mexican Peso (MXN) vs. the US Dollar (USD). But any US inflation surprises, or a risk of a ‘hard landing’ increasing in the US, could spur a flight to safety, weighing on the emerging market currency.
USD/MXN Price Analysis: Technical outlook
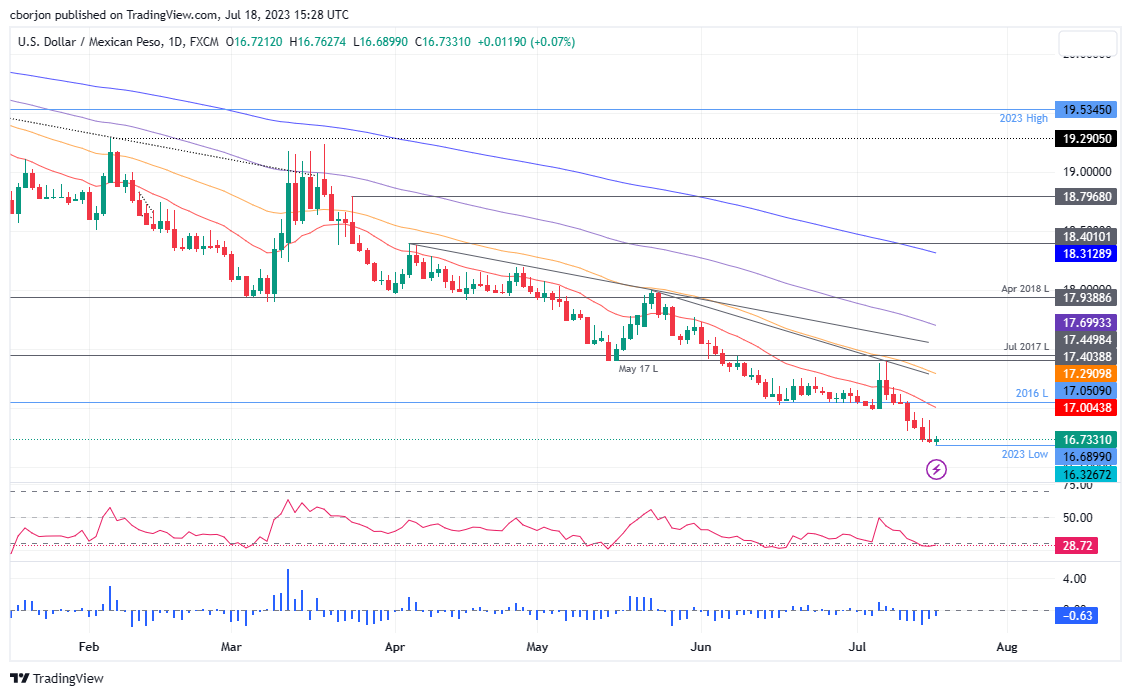
The daily chart shows the USD/MXN as poised to the downside. The Relative Strength Index (RSI) indicator remains at oversold territory, with no intentions to get back above the 30 levels, while the three-day Rate of Change (RoC) portrays sellers jumping in after flashing signs of selling pressure abating. Nevertheless, selling pressure remains weaker than the prior’s day, as revealed by the RoC. That said, the USD/MXN first support emerges at 16.5000, followed by the confluence of the 200-month EMA at 16.3000, nearby the October 2015 swing low of 16.3267. On the flip side, the USD/MXN first resistance would be the 20-day EMA at 17.0032.
Author

Christian Borjon Valencia
FXStreet
Markets analyst, news editor, and trading instructor with over 14 years of experience across FX, commodities, US equity indices, and global macro markets.


