USD/MXN rises as debt-ceiling standoff triggers market jitters, shift sentiment sour
- USD/MXN pair trades higher, fueled by risk-off sentiment and declining US bond yields.
- The Conference Board reports a decline in Consumer Confidence in May, reflecting a gloomy outlook among consumers, while housing prices rise above expectations.
- Richmond Fed President Barkin warns of stubborn inflation and mixed economic signals.

USD/MXN climbs amidst a risk-off impulse as some Republicans said they would oppose a bipartisan agreement to lift the US debt ceiling, even though the US government could fail to pay its obligations. That shifted sentiment while US bond yields plunged. At the time of writing, the USD/MXN is trading at 17.6757, a gain of 0.52%.
GOP opposition threatens bipartisan debt ceiling agreement, fuels economic uncertainty, USD/MXN climbs
US equities trade mixed; after a sudden shift in market sentiment, major indices pared their earlier gains. The US debt ceiling saga continues, with the GOP right-wing expected to oust Kevin McCarthy as House Speaker. On the data front, the US housing prices in March rose above estimates though they failed to trigger a reaction on the USD/MXN pair.
Later, the US Conference Board (CB) revealed that Consumer Confidence in May slowed to 102.3, above estimates but below April’s 103.7. “Consumer confidence declined in May as consumers’ view of current conditions became somewhat less upbeat while their expectations remained gloomy,” said Ataman Ozyildirim, Senior Director, Economics at The Conference Board. The report showed that Americans’ inflation expectations remain elevated but stable at a 6.1% average over the next 12 months.
The Dallas Fed Manufacturing Index for May plummeted by -29.1, below the previous month’s -23.4 contraction, signaling that business activity continued to deteriorate.
Aside from this, Richmond Fed President Thomas Barkin said that parts of the economy are giving mixed signals and that inflation is going to be more stubborn “than many people would think.”
The US Dollar Index (DXY), a gauge that measures the buck’s value against a basket of six currencies, is down 0.06%, at 104.116.
USD/MXN Price Analysis: Technical outlook
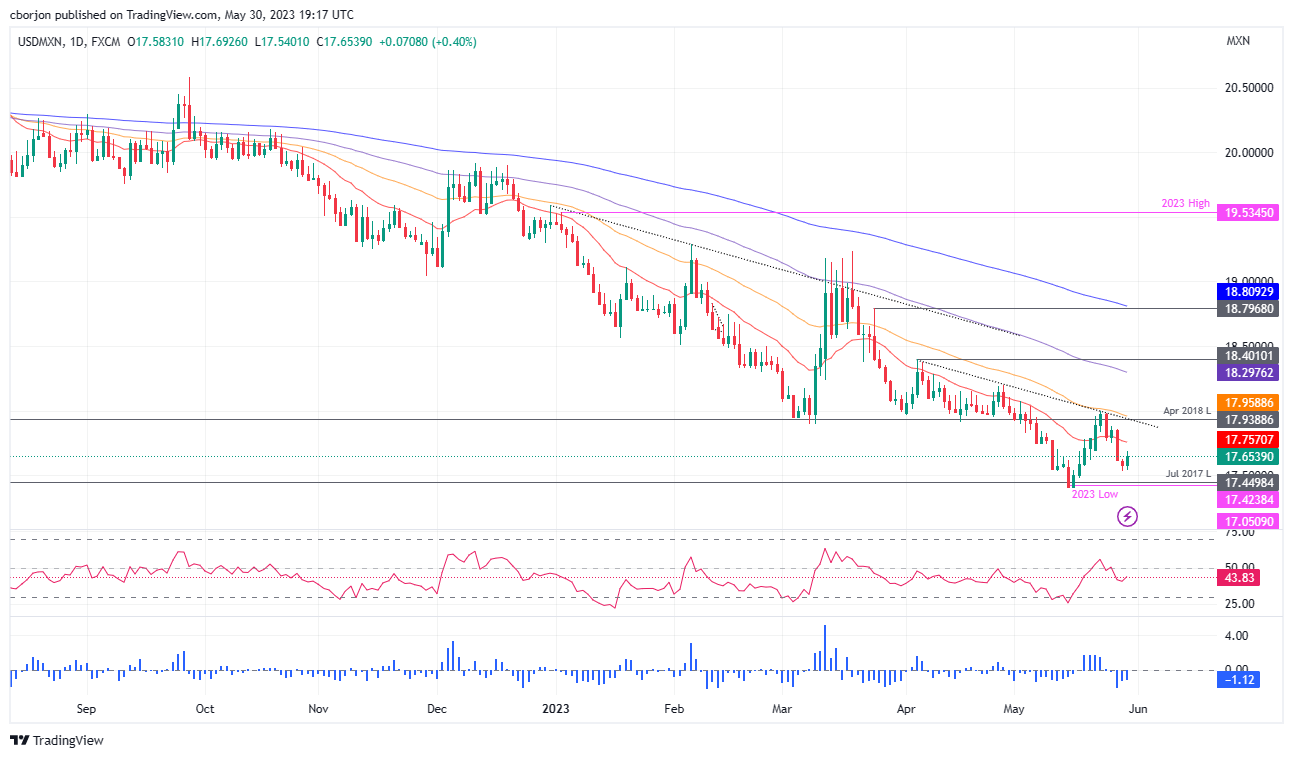
After two consecutive days of losses, the USD/MXN shifted upwards, though the rallies could be capped by solid resistance at the 20-day Exponential Moving Average (EMA) at 17.7600. Oscillators like the Relative Strength Index (RSI) indicator and the 3-day Rate of Change (RoC) are still in bearish territory, but the RSI is about to cross above the 50-midline.
For a bullish scenario, once USD/MXN buyers reclaim the 20-day EMA, that would open the door toward the confluence of a one-month-old falling resistance trendline and the 50-day EMA at 17.9593. Once cleared, the 18.00 figure is up for grabs. Conversely, the USD/MXN must reclaim the weekly low of 17.5341 before challenging the year-to-date (YTD) low of 17.4238.
Author

Christian Borjon Valencia
FXStreet
Markets analyst, news editor, and trading instructor with over 14 years of experience across FX, commodities, US equity indices, and global macro markets.


