|

USD/MXN reclaims 18.0000 after testing a four-week low, post weak US PMIs

  • US Manufacturing PMI data reveals recessionary signs as business activity contracts.
  • US Treasury bond yields fall sharply as odds for another rate hike remain uncertain.
  • Strong PMI reading indicates continued growth in Mexico’s manufacturing sector.

USD/MXN climbs back above the 18.0000 thresholds after testing four-week lows around 17.9644 in the early North American session. Despite broad US Dollar (USD) weakness, outward flows from the emerging markets currency weakened the Mexican Peso (MXN). At the time of writing, the USD/MXN is trading at 18.0420.

US Manufacturing PMI data reveals recessionary signs as business activity contracts

Wall Street closed with gains, except for the heavy tech Nasdaq 100. US Treasury bond yields fell sharply, as odds for another rate hike lie at 52.4%. However, money market futures are already pricing in two rate cuts by the end of 2023.

Earlier data showed a slew of Manufacturing PMI data for the United States (US) flashed recessionary signs in the US. The S&P Global and ISM revealed that business activity contracted, with the latter decreasing to 46.3 in March, below the forecast of around 47.5. The gauge plummeted to its lowest since May 2020, weighed by worse-than-estimated new orders and employment measures.

The greenback continued to extend its losses, as the US Dollar Index fell 0.52% to 102.063. US

Consequently, the greenback erased some of its earlier gains, bolstered by higher oil prices. The US Dollar Index (DXY), which tracks the buck’s value vs. a basket of six currencies, slides from 103.05 to 102.20, down 0.38%.

On the Mexican front, Business Confidence in Mexico rose to 52.9, above February’s 52.1. The S&P Global Manufacturing PMI for March registered 51.6 points. In the last 32 months (since August 2020), the indicator has been above 50 points, which is still the expansion zone.

USD/MXN Technical analysis

USD/MXN Daily chart

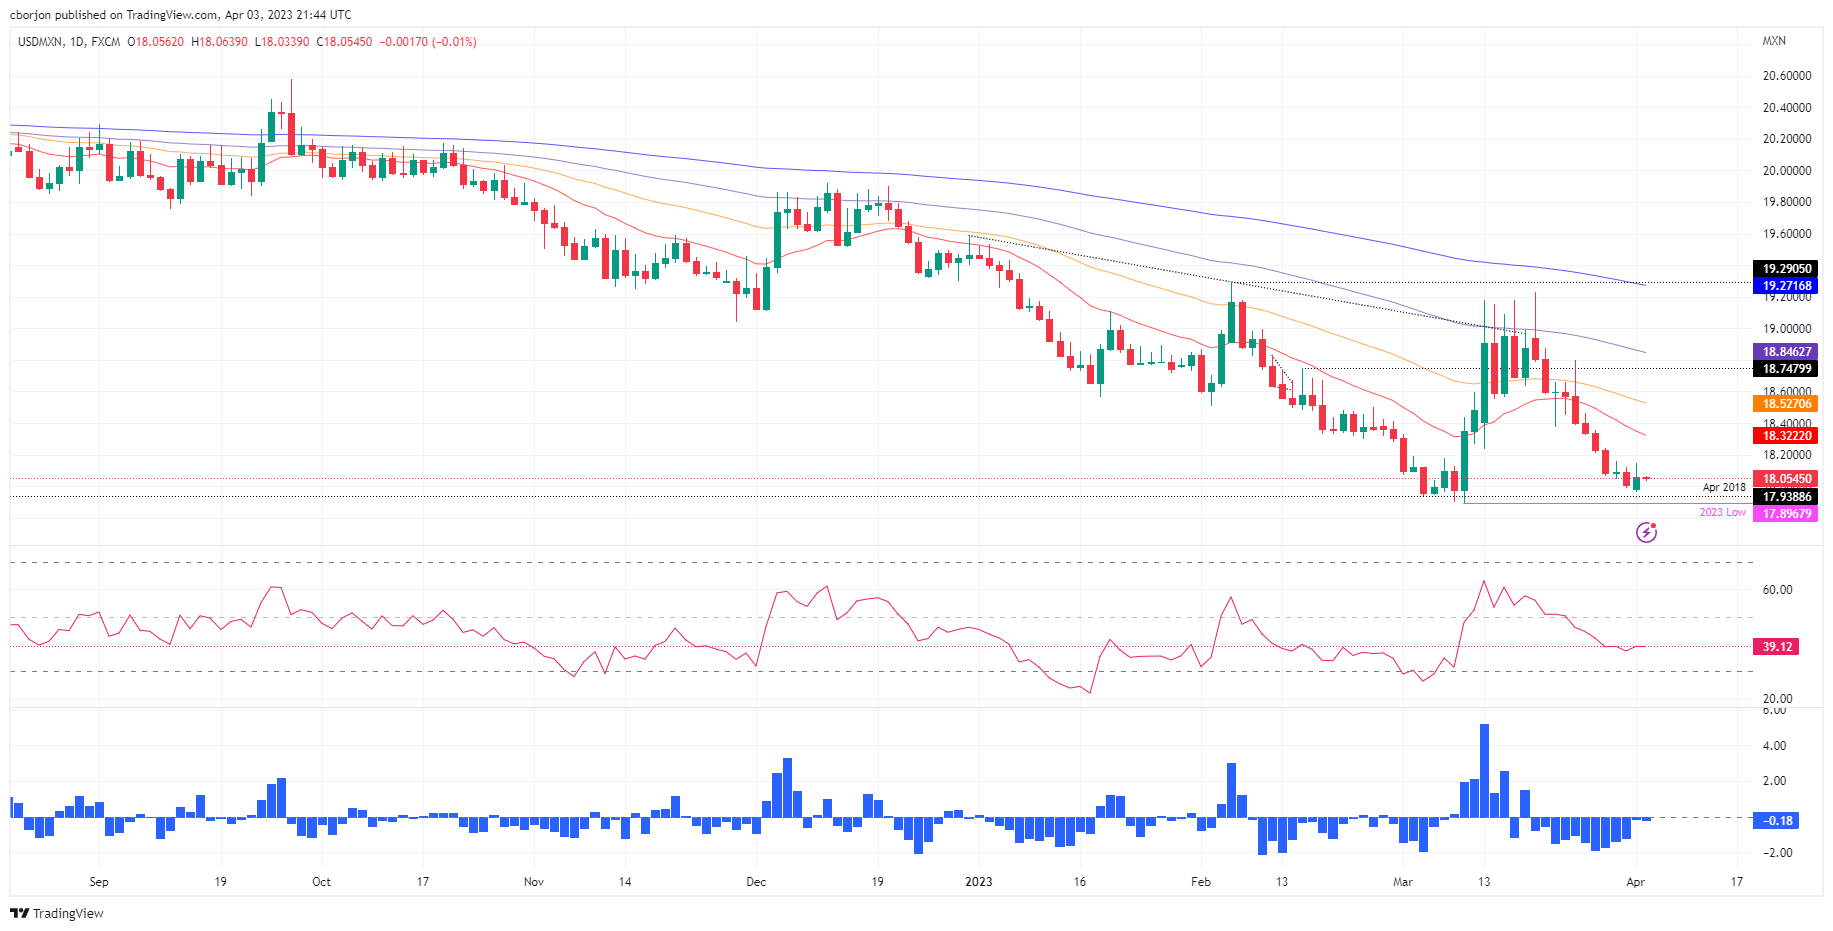
From a technical perspective, the USD/MXN remains neutral to downward biased. Although Monday’s price action was bullish, an inverted hammer, preceded by a downtrend and a daily close around the previous candle mid-point, could open the door for further downside. Therefore, the USD/MXN first support would be the 18.0000 mark. Breach of the latter will expose the YTD low of 17.8968, followed by 17.5000.

USD/MXN

Overview
Today last price18.0678
Today Daily Change0.0428
Today Daily Change %0.24
Today daily open18.025
 
Trends
Daily SMA2018.4438
Daily SMA5018.5308
Daily SMA10018.9507
Daily SMA20019.5319
 
Levels
Previous Daily High18.1246
Previous Daily Low17.99
Previous Weekly High18.4681
Previous Weekly Low17.99
Previous Monthly High19.2324
Previous Monthly Low17.8977
Daily Fibonacci 38.2%18.0414
Daily Fibonacci 61.8%18.0732
Daily Pivot Point S117.9685
Daily Pivot Point S217.912
Daily Pivot Point S317.8339
Daily Pivot Point R118.103
Daily Pivot Point R218.1811
Daily Pivot Point R318.2376
 

Author

Christian Borjon Valencia

Markets analyst, news editor, and trading instructor with over 14 years of experience across FX, commodities, US equity indices, and global macro markets.

More from Christian Borjon Valencia
Share:

Editor's Picks

EUR/USD off highs, back to 1.1850

EUR/USD loses some upside momentum, returning to the 1.1850 region amid humble losses. The pair’s slight decline comes against the backdrop of a marginal advance in the US Dollar as investors continue to assess the latest US CPI readings.

GBP/USD advances to daily tops around 1.3650

GBP/USD now manages to pick up extra pace, clinching daily highs around 1.3650 and leaving behind three consecutive daily pullbacks on Friday. Cable’s improved sentiment comes on the back of the inconclusive price action of the Greenback, while recent hawkish comments from the BoE’s Pill also collaborates with the uptick.

Gold surpasses $5,000/oz, daily highs

Gold is reclaiming part of the ground lost on Wednesday’s marked decline, as bargain-hunters keep piling up and lifting prices past the key $5,000 per troy ounce. The yellow metal’s upside is also propped up by the lack of clear direction around the US Dollar post-US CPI release.

Crypto Today: Bitcoin, Ethereum, XRP in choppy price action, weighed down by falling institutional interest 

Bitcoin's upside remains largely constrained amid weak technicals and declining institutional interest. Ethereum trades sideways above $1,900 support with the upside capped below $2,000 amid ETF outflows.

Week ahead – Data blitz, Fed Minutes and RBNZ decision in the spotlight

US GDP and PCE inflation are main highlights, plus the Fed minutes. UK and Japan have busy calendars too with focus on CPI. Flash PMIs for February will also be doing the rounds. RBNZ meets, is unlikely to follow RBA’s hawkish path.

Ripple Price Forecast: XRP potential bottom could be in sight

Ripple edges up above the intraday low of $1.35 at the time of writing on Friday amid mixed price actions across the crypto market. The remittance token failed to hold support at $1.40 the previous day, reflecting risk-off sentiment amid a decline in retail and institutional sentiment.