USD/MXN Price Analysis: Recovery remains elusive below 18.16


  • USD/MXN struggles to extend two-day rebound from multi-month low, sidelined of late.
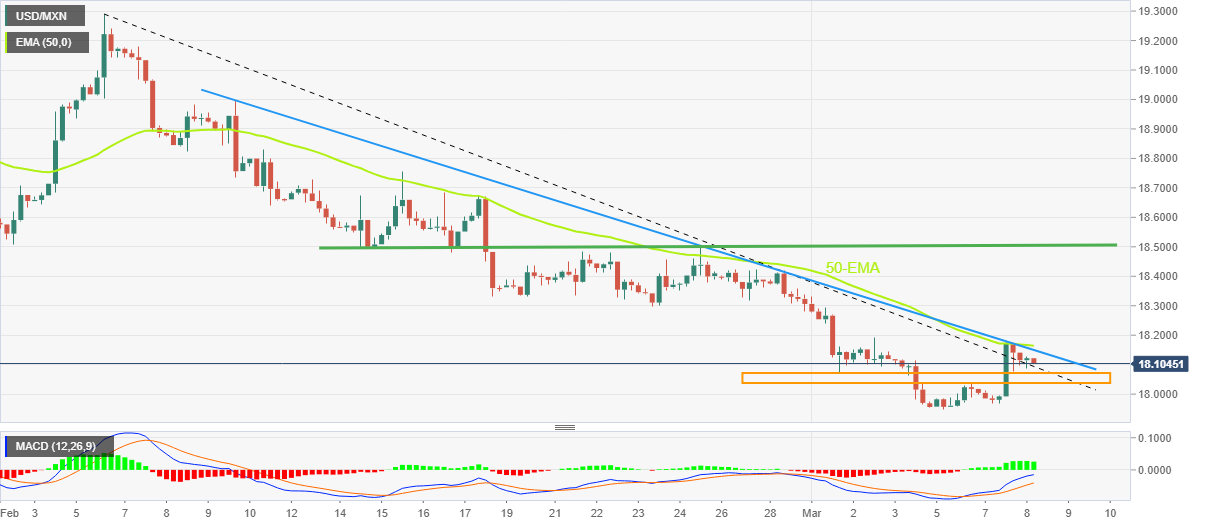
  • Failure to cross 50-EMA, one-month-old falling trend line recalls bears.
  • One-week-long horizontal support area can restrict immediate downside.

USD/MXN retreats from intraday high, snapping a two-day uptrend, as it drops to 18.10 heading into Wednesday’s European session. In doing so, the Mexican Peso (MXN) pair fades the early-week rebound from the lowest levels since April 2018.

USD/MXN rose the most in more than a month the previous day on crossing the one-week-old horizontal resistance area surrounding 18.03-07. The recovery moves also surpass a downward-sloping trend line from February 06.

However, failure to cross a convergence of the one-month-long descending resistance line and 50-bar Exponential Moving Average (EMA), around 18.15-16 by the press time, recalled the USD/MXN bears.

Even so, the previous support line from early February, around 18.10 restricts the quote’s immediate downside ahead of the resistance-turned-support zone near 18.07-03.

Following that, the 18.00 round figure could prod the USD/MXN bears before directing them to the recently flashed multi-month low of 17.94.

On the contrary, a clear upside break of the 18.15-16 resistance confluence becomes necessary for the USD/MXN bulls to take entries.

Though, the Mexican Peso pair buyers remain off the table unless witnessing a clear upside break of the one-month-old horizontal resistance, around 18.50.

Overall, USD/MXN is likely to remain depressed even as the buyers managed to keep the reins in the last two days.

USD/MXN: Four-hour chart

Trend: Further downside expected

Additional important levels

Overview
Today last price 18.1163
Today Daily Change 0.0003
Today Daily Change % 0.00%
Today daily open 18.116
 
Trends
Daily SMA20 18.3969
Daily SMA50 18.7578
Daily SMA100 19.1758
Daily SMA200 19.666
 
Levels
Previous Daily High 18.1793
Previous Daily Low 17.9686
Previous Weekly High 18.4235
Previous Weekly Low 17.9541
Previous Monthly High 19.2901
Previous Monthly Low 18.2954
Daily Fibonacci 38.2% 18.0988
Daily Fibonacci 61.8% 18.0491
Daily Pivot Point S1 17.9966
Daily Pivot Point S2 17.8772
Daily Pivot Point S3 17.7858
Daily Pivot Point R1 18.2074
Daily Pivot Point R2 18.2987
Daily Pivot Point R3 18.4181


Share: Feed news

Information on these pages contains forward-looking statements that involve risks and uncertainties. Markets and instruments profiled on this page are for informational purposes only and should not in any way come across as a recommendation to buy or sell in these assets. You should do your own thorough research before making any investment decisions. FXStreet does not in any way guarantee that this information is free from mistakes, errors, or material misstatements. It also does not guarantee that this information is of a timely nature. Investing in Open Markets involves a great deal of risk, including the loss of all or a portion of your investment, as well as emotional distress. All risks, losses and costs associated with investing, including total loss of principal, are your responsibility. The views and opinions expressed in this article are those of the authors and do not necessarily reflect the official policy or position of FXStreet nor its advertisers. The author will not be held responsible for information that is found at the end of links posted on this page.

If not otherwise explicitly mentioned in the body of the article, at the time of writing, the author has no position in any stock mentioned in this article and no business relationship with any company mentioned. The author has not received compensation for writing this article, other than from FXStreet.

FXStreet and the author do not provide personalized recommendations. The author makes no representations as to the accuracy, completeness, or suitability of this information. FXStreet and the author will not be liable for any errors, omissions or any losses, injuries or damages arising from this information and its display or use. Errors and omissions excepted.

The author and FXStreet are not registered investment advisors and nothing in this article is intended to be investment advice.

XM
Account
7.2
Tools
9.2
Service
9.4
Trading
9.0
Trust
7.0
Experience
8.4
Read review
Moneta Markets
Account
7.4
Tools
6.6
Service
8.0
Trading
6.6
Trust
5.2
Experience
9.2
Read review
Trading Pro
Account
7.2
Tools
5.2
Service
6.6
Trading
8.0
Trust
5.0
Experience
7.0
Read review
Pepperstone
Account
8.2
Tools
8.2
Service
7.4
Trading
9.0
Trust
8.8
Experience
9.0
Read review
XM
Read review
Moneta Markets
Read review
Trading Pro
Read review
Pepperstone
Read review
Trading Pro
Read review
Pepperstone
Read review
XM
Read review
Moneta Markets
Read review
Trading Pro
Account
7.2
Tools
5.2
Service
6.6
Trading
8.0
Trust
5.0
Experience
7.0
Read review
Pepperstone
Account
8.2
Tools
8.2
Service
7.4
Trading
9.0
Trust
8.8
Experience
9.0
Read review
XM
Account
7.2
Tools
9.2
Service
9.4
Trading
9.0
Trust
7.0
Experience
8.4
Read review
Moneta Markets
Account
7.4
Tools
6.6
Service
8.0
Trading
6.6
Trust
5.2
Experience
9.2
Read review

Recommended content


Recommended content

Editors’ Picks

Gold corrects from record high set at $3,500

Gold corrects from record high set at $3,500

Gold price pulls away from the record peak it set at $3,500 earlier in the day as buyers take a breather amid overbought conditions on short-term charts. Any meaningful corrective downfall, however, still seems elusive as US Dollar downtrend remains intact. 

Gold News
EUR/USD retreats below 1.1500 as US Dollar stabilizes

EUR/USD retreats below 1.1500 as US Dollar stabilizes

EUR/USD corrects lower following Monday's rally and trades below 1.1500 on Tuesday. The pair loses traction as the US Dollar finds its feet, even as investors remain wary of the US financial stability amid Trump's attacks on Fed Chair Powell. Speeches from ECB and Fed officials are on the radar. 

EUR/USD News
GBP/USD stays below 1.3400 as USD selloff pauses

GBP/USD stays below 1.3400 as USD selloff pauses

GBP/USD fluctuates in a tight range below 1.3400 on Tuesday as the modest recovery seen in the US Dollar caps the pair's upside. Nevertheless, the pair's further downside appears limited as fears of a US economic slowdown and concerns about the Fed's independence remain a headwind for the Greenback. 

GBP/USD News
3% of Bitcoin supply in control of firms with BTC on balance sheets: The good, bad and ugly

3% of Bitcoin supply in control of firms with BTC on balance sheets: The good, bad and ugly

Bitcoin disappointed traders with lackluster performance in 2025, hitting the $100,000 milestone and consolidating under the milestone thereafter. Bitcoin rallied past $88,000 early on Monday, the dominant token eyes the $90,000 level.

Read more
Five fundamentals for the week: Traders confront the trade war, important surveys, key Fed speech

Five fundamentals for the week: Traders confront the trade war, important surveys, key Fed speech Premium

Will the US strike a trade deal with Japan? That would be positive progress. However, recent developments are not that positive, and there's only one certainty: headlines will dominate markets. Fresh US economic data is also of interest.

Read more
The Best brokers to trade EUR/USD

The Best brokers to trade EUR/USD

SPONSORED Discover the top brokers for trading EUR/USD in 2025. Our list features brokers with competitive spreads, fast execution, and powerful platforms. Whether you're a beginner or an expert, find the right partner to navigate the dynamic Forex market.

Read More

Forex MAJORS

Cryptocurrencies

Signatures

Best Brokers of 2025