- USD/MXN prints the first daily gains in three, bounces off the lowest levels since 2016.
- Immediate resistance break joins upbeat oscillators to favor short-term pair buyers.
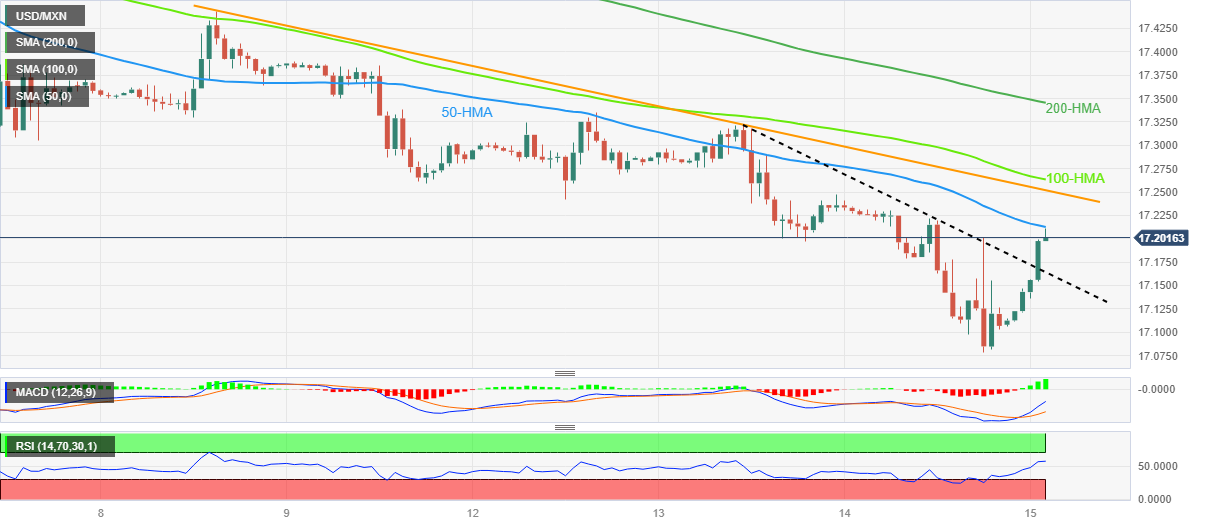
- Mexican Peso sellers need to conquer 200-HMA to topple bulls.
USD/MXN grinds near intraday high of around 17.20 as it prod the 50-Hour Moving Average (HMA) during the first positive day in three on early Thursday. In doing so, the Mexican Peso (MXN) pair defends the late Wednesday’s rebound from the lowest levels since 2016.
That said, a clear break of the previous resistance line stretched from Tuesday joins bullish MACD signals and upbeat RSI (14) line, not overbought, to keep the USD/MXN bulls hopeful.
However, multiple hurdles toward the north keep challenging the pair’s upside momentum.
Among them, the 50-HMA level of around 17.21 guards immediate recovery ahead of a one-week-old downward-sloping resistance line, around 17.25 by the press time.
Following that, the 100-HMA and the 200-HMA, respectively near 17.26 and 17.35 in that order, will challenge the USD/MXN bulls before giving control to them.
On the flip side, a clear break of the resistance-turned-support line, near 17.16 by the press time, becomes necessary to convince USD/MXN sellers.
Following that, the bears may easily conquer the latest trough of 17.07 in search of poking the 17.00 psychological magnet.
It should be noted that the year 2016 bottom of around 17.05 acts as an extra filter toward the south.
USD/MXN: Hourly chart
Trend: Pullback expected
Information on these pages contains forward-looking statements that involve risks and uncertainties. Markets and instruments profiled on this page are for informational purposes only and should not in any way come across as a recommendation to buy or sell in these assets. You should do your own thorough research before making any investment decisions. FXStreet does not in any way guarantee that this information is free from mistakes, errors, or material misstatements. It also does not guarantee that this information is of a timely nature. Investing in Open Markets involves a great deal of risk, including the loss of all or a portion of your investment, as well as emotional distress. All risks, losses and costs associated with investing, including total loss of principal, are your responsibility. The views and opinions expressed in this article are those of the authors and do not necessarily reflect the official policy or position of FXStreet nor its advertisers. The author will not be held responsible for information that is found at the end of links posted on this page.
If not otherwise explicitly mentioned in the body of the article, at the time of writing, the author has no position in any stock mentioned in this article and no business relationship with any company mentioned. The author has not received compensation for writing this article, other than from FXStreet.
FXStreet and the author do not provide personalized recommendations. The author makes no representations as to the accuracy, completeness, or suitability of this information. FXStreet and the author will not be liable for any errors, omissions or any losses, injuries or damages arising from this information and its display or use. Errors and omissions excepted.
The author and FXStreet are not registered investment advisors and nothing in this article is intended to be investment advice.
Recommended content
Editors’ Picks

USD/JPY off lows but heavy near 151.50 amid upbeat Japan's Q4 GDP
USD/JPY is off the lows but holds moderates losses near 151.50 early Monday. Japan's prelimimary GDP report showed the economy expanded 0.7% QoQ and 2.8% YoY in Q4. The data blew past market expectations and reaffirmed bets for another BoJ rate hike, boosting the Japanese Yen.

AUD/USD holds gains above 0.6350 amid US Dollar weakness
AUD/USD holds gains above 0.6350 in the Asian session on Monday. The sustained US Dollar weakness and prospects of Russia-US meeting outweigh dovish RBA expectations, supporting the pair amid a US holiday-thinned market. All eyes remain on Tuesday's RBA interest rate decision.

Gold buyers regain poise as focus shifts to US-Russia meeting
Gold price rebounds after Friday’s profit-taking slide; light trading could exaggerate moves. The US Dollar and US Treasury yields consolidate losses, bracing for US-Russia talks and Fed Minutes.

Bitcoin, Ethereum and Ripple hold steady while XRP gains momentum
Bitcoin has been consolidating between $94,000 and $100,000 for almost two weeks. Ethereum price follows in BTC’s footsteps and hovers around $2,680, while Ripple shows strength and extends its gains on Monday after rallying 14% last week.

Tariffs likely to impart a modest stagflationary hit to the economy this year
The economic policies of the Trump administration are starting to take shape. President Trump has already announced the imposition of tariffs on some of America's trading partners, and we assume there will be more levies, which will be matched by foreign retaliation, in the coming quarters.

The Best Brokers of the Year
SPONSORED Explore top-quality choices worldwide and locally. Compare key features like spreads, leverage, and platforms. Find the right broker for your needs, whether trading CFDs, Forex pairs like EUR/USD, or commodities like Gold.