USD/MXN Price Analysis: Mexican Peso sellers tighten grip above 18.00


  • USD/MXN regains upside momentum after probing bulls the previous day.
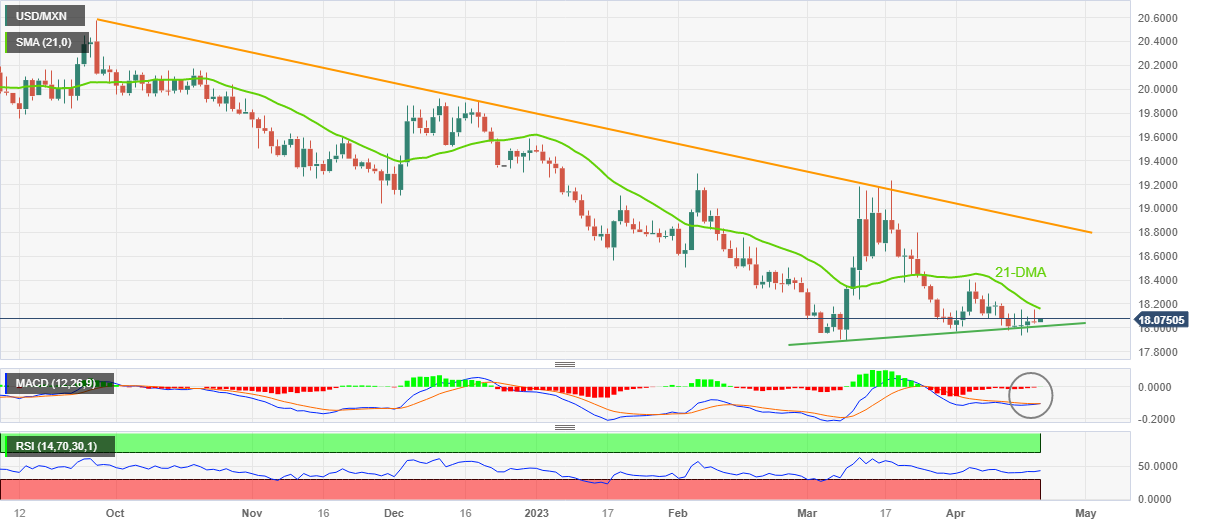
  • Sustained trading above six-week-old ascending support line, looming bull cross on MACD favor buyers.
  • 21-DMA holds the key to further run-up towards monthly top, bearish trend remain intact below 18.90.
  • Downside break of 18.00 could trigger fresh fall targeting YTD low.

USD/MXN picks up bids to 18.07 as it grinds near intraday high, up 0.15% on a day amid early Thursday in Europe.

That said, the Mexican Peso (MXN) pair snapped a three-day uptrend the previous day but failed to provide a daily closing beneath an important support line, which in turn joined a looming bull cross on the MACD indicator to recall the buyers.

Not only the impending price-positive signals on the MACD indicator and the pair’s sustained trading beyond a 1.5-month-old support line but steady RSI (14) also hints at the continuation of the recovery moves.

With this, the USD/MXN buyers are all set to approach the 21-DMA hurdle of around 18.15, a break of which could propel the prices toward the monthly high of 18.40.

It’s worth noting, however, that the USD/MXN run-up beyond 18.40 highlights a downward-sloping resistance line from the last September, around 18.90, which holds the key to reversing the pair’s multi-month-old bearish trend.

On the contrary, an upward-sloping trend line from early March, close to the 18.00 round figure, puts a floor under the USD/MXN prices for the short term.

Following that, the recently flashed multi-month low of 17.89 and lows marked in June 2017 around 17.80, as well as the year 2017 bottom surrounding 17.44, will be in the spotlight.

USD/MXN: Daily chart

Trend: Further recovery expected

Additional important levels

Overview
Today last price 18.0754
Today Daily Change 0.0274
Today Daily Change % 0.15%
Today daily open 18.048
 
Trends
Daily SMA20 18.164
Daily SMA50 18.3443
Daily SMA100 18.7876
Daily SMA200 19.3825
 
Levels
Previous Daily High 18.1531
Previous Daily Low 18.033
Previous Weekly High 18.2844
Previous Weekly Low 17.9753
Previous Monthly High 19.2324
Previous Monthly Low 17.8977
Daily Fibonacci 38.2% 18.0789
Daily Fibonacci 61.8% 18.1072
Daily Pivot Point S1 18.003
Daily Pivot Point S2 17.9579
Daily Pivot Point S3 17.8829
Daily Pivot Point R1 18.1231
Daily Pivot Point R2 18.1982
Daily Pivot Point R3 18.2433


Share: Feed news

Information on these pages contains forward-looking statements that involve risks and uncertainties. Markets and instruments profiled on this page are for informational purposes only and should not in any way come across as a recommendation to buy or sell in these assets. You should do your own thorough research before making any investment decisions. FXStreet does not in any way guarantee that this information is free from mistakes, errors, or material misstatements. It also does not guarantee that this information is of a timely nature. Investing in Open Markets involves a great deal of risk, including the loss of all or a portion of your investment, as well as emotional distress. All risks, losses and costs associated with investing, including total loss of principal, are your responsibility. The views and opinions expressed in this article are those of the authors and do not necessarily reflect the official policy or position of FXStreet nor its advertisers. The author will not be held responsible for information that is found at the end of links posted on this page.

If not otherwise explicitly mentioned in the body of the article, at the time of writing, the author has no position in any stock mentioned in this article and no business relationship with any company mentioned. The author has not received compensation for writing this article, other than from FXStreet.

FXStreet and the author do not provide personalized recommendations. The author makes no representations as to the accuracy, completeness, or suitability of this information. FXStreet and the author will not be liable for any errors, omissions or any losses, injuries or damages arising from this information and its display or use. Errors and omissions excepted.

The author and FXStreet are not registered investment advisors and nothing in this article is intended to be investment advice.

XM
Account
7.2
Tools
9.2
Service
9.4
Trading
9.0
Trust
7.0
Experience
8.4
Read review
Moneta Markets
Account
7.4
Tools
6.6
Service
8.0
Trading
6.6
Trust
5.2
Experience
9.2
Read review
Trading Pro
Account
7.2
Tools
5.2
Service
6.6
Trading
8.0
Trust
5.0
Experience
7.0
Read review
Pepperstone
Account
8.2
Tools
8.2
Service
7.4
Trading
9.0
Trust
8.8
Experience
9.0
Read review
XM
Read review
Moneta Markets
Read review
Trading Pro
Read review
Pepperstone
Read review
Trading Pro
Read review
Pepperstone
Read review
XM
Read review
Moneta Markets
Read review
Trading Pro
Account
7.2
Tools
5.2
Service
6.6
Trading
8.0
Trust
5.0
Experience
7.0
Read review
Pepperstone
Account
8.2
Tools
8.2
Service
7.4
Trading
9.0
Trust
8.8
Experience
9.0
Read review
XM
Account
7.2
Tools
9.2
Service
9.4
Trading
9.0
Trust
7.0
Experience
8.4
Read review
Moneta Markets
Account
7.4
Tools
6.6
Service
8.0
Trading
6.6
Trust
5.2
Experience
9.2
Read review

Recommended content


Recommended content

Editors’ Picks

EUR/USD Gains look limited by 1.1570

EUR/USD Gains look limited by 1.1570 Premium

EUR/USD trades well on the defensive for the second day in a row, revisinting the mid-1.1300s on the back of the continuation of the upside impulse in the US dollar. The move followed firmer US PMI data and news indicating the White House may be considering tariff cuts on Chinese imports.

EUR/USD News
GBP/USD deflates to the sub-1.3300 area, USD bulls prevail

GBP/USD deflates to the sub-1.3300 area, USD bulls prevail

GBP/USD remained on the back foot Wednesday, slipping below the 1.3300 level as the Greenback gained further traction. The Dollar’s solid performance was supported by strong US data and fading concerns over a renewed escalation in the US–China trade dispute.

GBP/USD News
Gold corrected extreme conditions, struggles around $3,300

Gold corrected extreme conditions, struggles around $3,300

Gold extended its decline on Wednesday, slipping below the $3,300 mark per troy ounce in response to reports from the media suggesting the Trump administration is weighing tariff reductions on Chinese goods, a news that revived hopes of easing trade tensions and reduced demand for the yellow metal as a safe-haven asset.

Gold News
Bitcoin bullish momentum builds as premium exceeds 9% for first time in three months

Bitcoin bullish momentum builds as premium exceeds 9% for first time in three months

Bitcoin price is extending its gains, trading above $94,000 at the time of writing on Wednesday, following a two-day rally of 9.75% so far this week. BTC rally gathers momentum as trade war fears ease, following US President Donald Trump’s downplaying of tensions with China.

Read more
Five fundamentals for the week: Traders confront the trade war, important surveys, key Fed speech

Five fundamentals for the week: Traders confront the trade war, important surveys, key Fed speech Premium

Will the US strike a trade deal with Japan? That would be positive progress. However, recent developments are not that positive, and there's only one certainty: headlines will dominate markets. Fresh US economic data is also of interest.

Read more
The Best brokers to trade EUR/USD

The Best brokers to trade EUR/USD

SPONSORED Discover the top brokers for trading EUR/USD in 2025. Our list features brokers with competitive spreads, fast execution, and powerful platforms. Whether you're a beginner or an expert, find the right partner to navigate the dynamic Forex market.

Read More

Forex MAJORS

Cryptocurrencies

Signatures

Best Brokers of 2025