|

USD/MXN Price Analysis: Mexican Peso sellers flex muscles, 17.20 in the spotlight

  • USD/MXN struggles to defend two-day winning streak ahead of Fed Minutes.
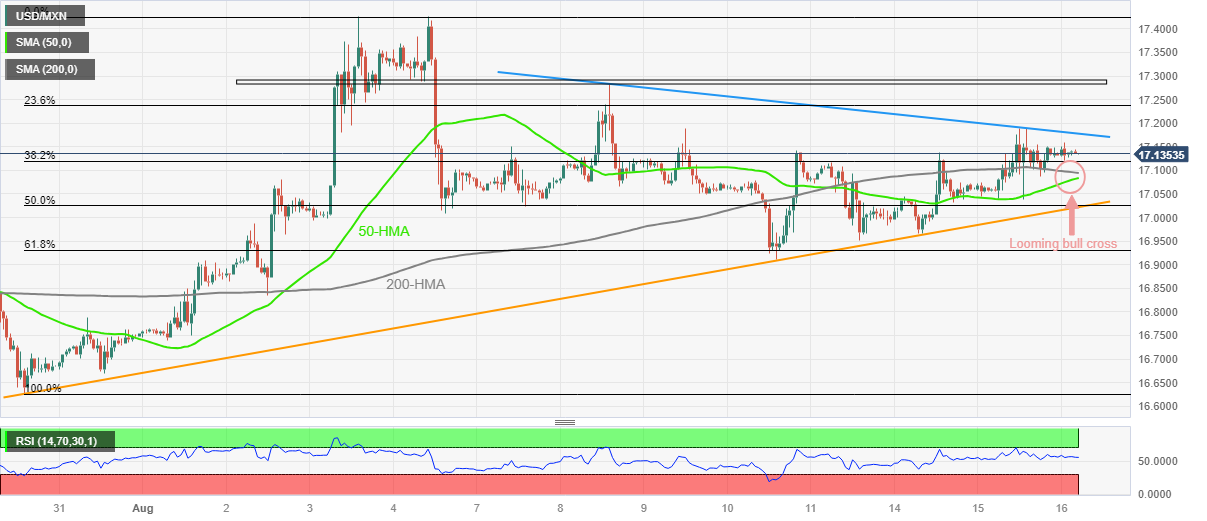
  • Impending bull cross between 50-HMA and 200-HMA joins firmer RSI (14) line to favor Mexican Peso sellers.
  • Pair seller need dovish remarks in FOMC Minutes, clear break of 17.00 to retake control.

USD/MXN retreats to 17.35 as bulls struggle to keep the reins amid the market’s consolidation ahead of the Federal Reserve’s (Fed) monetary policy meeting minutes. That said, the Mexican Peso (MXN) pair drops for the first day so far in three while fading the previous day’s rebound from the 200-Hour Moving Average (HMA).

It’s worth noting, however, that the 50-HMA is closing in on the 200-HMA from below and portrays a looming bull cross to lure the USD/MXN buyers.

Also suggesting the quote’s further upside is the RSI (14) line that stays sturdy beyond the 50.0 level.

Even so, the USD/MXN bulls need to cross the one-week-old falling resistance line surrounding 17.20, as well as gain support from the dovish minutes of the Federal Open Market Committee’s (FOMC) latest Monetary Policy Meeting Minutes, to retake control.

Following that, a horizontal area comprising levels marked since August 04, near 17.30, can prod the USD/MXN pair’s further upside before marking a run-up toward the monthly peak of near 17.42.

On the flip side, the 200-HMA and the 50-HMA restrict the immediate downside of the Mexican Peso pair to around 17.09-08.

In a case where the USD/MXN drops below the 17.08 support line, a convergence of an upward-sloping trend line from July 28 and the 50% Fibonacci retracement of late July to early August upside, near the 17.00 threshold, appears a tough nut to crack for the bears.

USD/MXN Price: Hourly chart

Trend: Further upside expected

Additional important levels

Overview
Today last price17.1359
Today Daily Change-0.0120
Today Daily Change %-0.07%
Today daily open17.1479
 
Trends
Daily SMA2016.9706
Daily SMA5017.0429
Daily SMA10017.4596
Daily SMA20018.2262
 
Levels
Previous Daily High17.1888
Previous Daily Low17.0388
Previous Weekly High17.2852
Previous Weekly Low16.9101
Previous Monthly High17.3957
Previous Monthly Low16.6258
Daily Fibonacci 38.2%17.1315
Daily Fibonacci 61.8%17.0961
Daily Pivot Point S117.0615
Daily Pivot Point S216.9751
Daily Pivot Point S316.9114
Daily Pivot Point R117.2116
Daily Pivot Point R217.2752
Daily Pivot Point R317.3616

Author

Anil Panchal

Anil Panchal

FXStreet

Anil Panchal has nearly 15 years of experience in tracking financial markets. With a keen interest in macroeconomics, Anil aptly tracks global news/updates and stays well-informed about the global financial moves and their implications.

More from Anil Panchal
Share:

Editor's Picks

EUR/USD slumps below 1.1750 as USD benefits from risk-aversion

EUR/USD comes under renewed bearish pressure in the European session and trades below 1.1750 following a recovery attempt earlier in the day. The US Dollar gathers strength and weighs on the pair as investors seek refuge in the wake of Israel and the United States' joint attack on Iran.

GBP/USD targets 1.3500 barrier near moving averages

GBP/USD rebounds from the daily losses, trading around 1.3450 during the Asian hours on Monday. The technical analysis of the daily chart indicates an ongoing bearish bias, as the pair trades within a descending channel pattern.

Gold surges on safe-haven demand, rises above $5,400

Gold benefits from intense risk-aversion on Monday and climbs above $5,400, setting a fresh monthly-high in the process. Tensions in the Middle East remain high as Israel and Hezbollah continue to exchange strikes following the US-Israel joint attack on Iran over the weekend.

Bitcoin, Ethereum and Ripple under pressure as key supports face breakdown risk

Bitcoin, Ethereum, and Ripple prices trade on the back foot at the start of this week on Monday, after extending losses in the previous week. BTC is on the brink of a breakdown, ETH is capped below key resistance, and XRP risks a crack of the trendline.

The market is paying for insurance, not apocalypse

As expected, this morning felt less like a Monday market open and more like a fire drill. Futures screens flickered red. S&P contracts down almost 1%. Nasdaq off 1.2%. Brent leaped 13% through $80. Gold rose 1.6% toward $5350 before paring some gains. The dollar is strutting mildly. The Swiss franc is quietly doing what it always does in a storm, catching some safe-haven flows.

Pi Network Price Forecast: Core team offloads supply, weighing on PI recovery

Pi Network  hovers below $0.1700, broadly steady at press time on Monday, attempting a recovery after a 2% loss the previous day. Sunday’s decline aligned with nearly 49 million PI tokens offloaded by the Pi Foundation, implying a spike in supply pressure that capped the prevailing four-day recovery.