USD/MXN Price Analysis: Mexican Peso rebound needs validation from 16.87 and US NFP


  • USD/MXN pares the biggest daily gain in a month but lacks downside momentum of late.
  • Clear upside break of triangle, sustained trading beyond the key SMA confluence favors Mexican Peso sellers.
  • Overbought RSI prods USD/MXN buyers ahead of US NFP.

USD/MXN takes offers to refreshe intraday bottom surrounding 16.98, after reversing from the weekly top, as markets brace for the key US employment report for August on Friday.

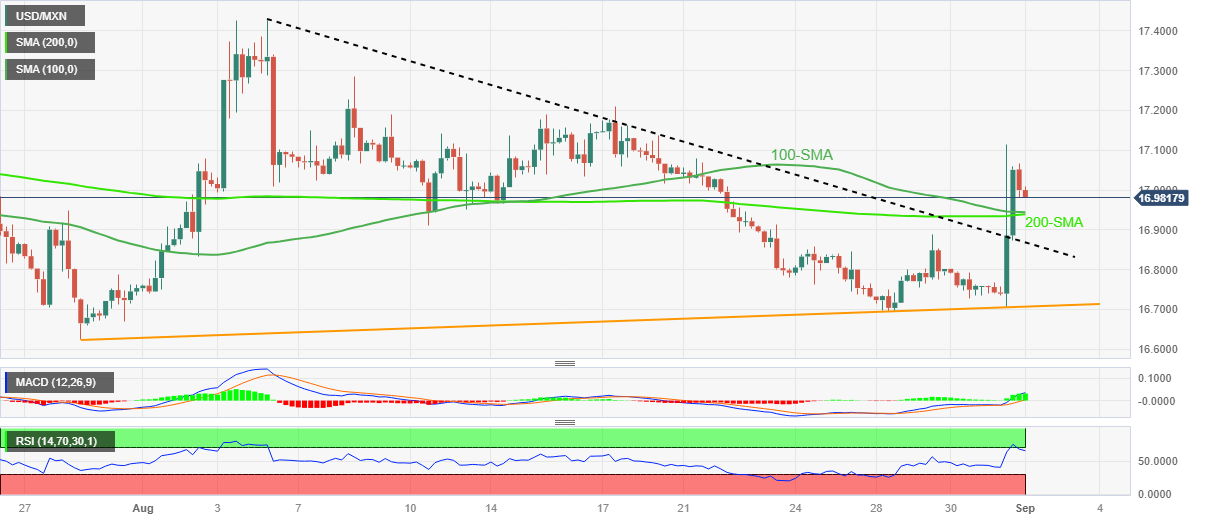
USD/MXN rallied the most in a month while refreshing the weekly top on Thursday after it crossed the top line of a five-week-old symmetrical triangle. The bullish breakout also gained support from the MACD signals to renew the multi-day top. However, the nearly overbought RSI and the pre-data positioning seem to weigh on the Mexican Peso (MXN) pair of late.

Even so, a convergence of the 100-SMA and 200-SMA, around 16.94–93, appears a tough nut to crack for the USD/MXN sellers.

Following that, the stated triangle’s top line surrounding 16.87 will be in the spotlight.

Should the USD/MXN bears keep the reins past 16.87, the odds of witnessing a fall toward the rising support line stretched from late July, near 16.70, can’t be ruled out.

On the contrary, the USD/MXN pair’s recovery needs to refresh the weekly top, currently around 17.11, to convince the buyers.

Even so, the mid-August swing high of 17.20 and the previous monthly peak surrounding 17.42 could test the Mexican Peso (MXN) sellers before giving them control.

USD/MXN: Four-hour chart

Trend: Recovery expected

Additional important levels

Overview
Today last price 16.9972
Today Daily Change -0.0463
Today Daily Change % -0.27%
Today daily open 17.0435
 
Trends
Daily SMA20 16.9812
Daily SMA50 16.9738
Daily SMA100 17.314
Daily SMA200 18.076
 
Levels
Previous Daily High 17.115
Previous Daily Low 16.7087
Previous Weekly High 17.08
Previous Weekly Low 16.7366
Previous Monthly High 17.4274
Previous Monthly Low 16.6945
Daily Fibonacci 38.2% 16.9598
Daily Fibonacci 61.8% 16.8639
Daily Pivot Point S1 16.7964
Daily Pivot Point S2 16.5494
Daily Pivot Point S3 16.3901
Daily Pivot Point R1 17.2028
Daily Pivot Point R2 17.3621
Daily Pivot Point R3 17.6092


Share: Feed news

Information on these pages contains forward-looking statements that involve risks and uncertainties. Markets and instruments profiled on this page are for informational purposes only and should not in any way come across as a recommendation to buy or sell in these assets. You should do your own thorough research before making any investment decisions. FXStreet does not in any way guarantee that this information is free from mistakes, errors, or material misstatements. It also does not guarantee that this information is of a timely nature. Investing in Open Markets involves a great deal of risk, including the loss of all or a portion of your investment, as well as emotional distress. All risks, losses and costs associated with investing, including total loss of principal, are your responsibility. The views and opinions expressed in this article are those of the authors and do not necessarily reflect the official policy or position of FXStreet nor its advertisers. The author will not be held responsible for information that is found at the end of links posted on this page.

If not otherwise explicitly mentioned in the body of the article, at the time of writing, the author has no position in any stock mentioned in this article and no business relationship with any company mentioned. The author has not received compensation for writing this article, other than from FXStreet.

FXStreet and the author do not provide personalized recommendations. The author makes no representations as to the accuracy, completeness, or suitability of this information. FXStreet and the author will not be liable for any errors, omissions or any losses, injuries or damages arising from this information and its display or use. Errors and omissions excepted.

The author and FXStreet are not registered investment advisors and nothing in this article is intended to be investment advice.

Trading Pro
Read review
Pepperstone
Read review
Trading Pro
Read review
Pepperstone
Read review

Recommended content


Recommended content

Editors’ Picks

EUR/USD holds above 1.0800 after German inflation data

EUR/USD holds above 1.0800 after German inflation data

EUR/USD struggles to gain traction and trades in a narrow channel above 1.0800 on Monday as the risk-averse market environment helps the US Dollar stay resilient against its rivals. Meanwhile, the data from Germany showed that the annual CPI inflation declined to 2.2% in March, as expected.

EUR/USD News
Gold sits at record highs above $3,100 amid tariff woes

Gold sits at record highs above $3,100 amid tariff woes

Gold price holds its record-setting rally toward $3,150 in the second half of the day on Monday. The bullion continues to capitalize on safe-haven flows amid intensifying global tariff war fears. US economic concerns weigh on US Treasury bond yields, allowing XAU/USD to push higher.

Gold News
GBP/USD stays in range near 1.2950 as mood sours

GBP/USD stays in range near 1.2950 as mood sours

GBP/USD fluctuates in a narrow channel at around 1.2950 at the beginning of the new week. Growing concerns over US President Donald Trump's tariffs igniting inflation and dampen economic growth weigh on risk mood and don't allow the pair to gain traction.

GBP/USD News
Seven Fundamentals for the Week:  “Liberation Day” tariffs and Nonfarm Payrolls to rock markets

Seven Fundamentals for the Week: “Liberation Day” tariffs and Nonfarm Payrolls to rock markets Premium

United States President Donald Trump is set to announce tariffs in the middle of the week; but reports, rumors, and counter-measures will likely dominate the headline. It is also a busy week on the economic data front, with a full buildup to the Nonfarm Payrolls (NFP) data for March.

Read more
US: Trump's 'Liberation day' – What to expect?

US: Trump's 'Liberation day' – What to expect?

Trump has so far enacted tariff changes that have lifted the trade-weighted average tariff rate on all US imports by around 5.5-6.0%-points. While re-rerouting of trade will decrease the effectiveness of tariffs over time, the current level is already close to the highest since the second world war. 

Read more
The Best brokers to trade EUR/USD

The Best brokers to trade EUR/USD

SPONSORED Discover the top brokers for trading EUR/USD in 2025. Our list features brokers with competitive spreads, fast execution, and powerful platforms. Whether you're a beginner or an expert, find the right partner to navigate the dynamic Forex market.

Read More

Forex MAJORS

Cryptocurrencies

Signatures

Best Brokers of 2025