USD/MXN Price Analysis: Mexican Peso pares biggest daily loss in two weeks around 16.88


  • USD/MXN retreats from weekly top marked the previous day, mildly offered of late.
  • Upside break of one-week-old falling trend line join bullish MACD signals to prod pair sellers.
  • Mexican Peso remains firmer unless defying 10-week-old trend channel by breaking 17.22 mark.

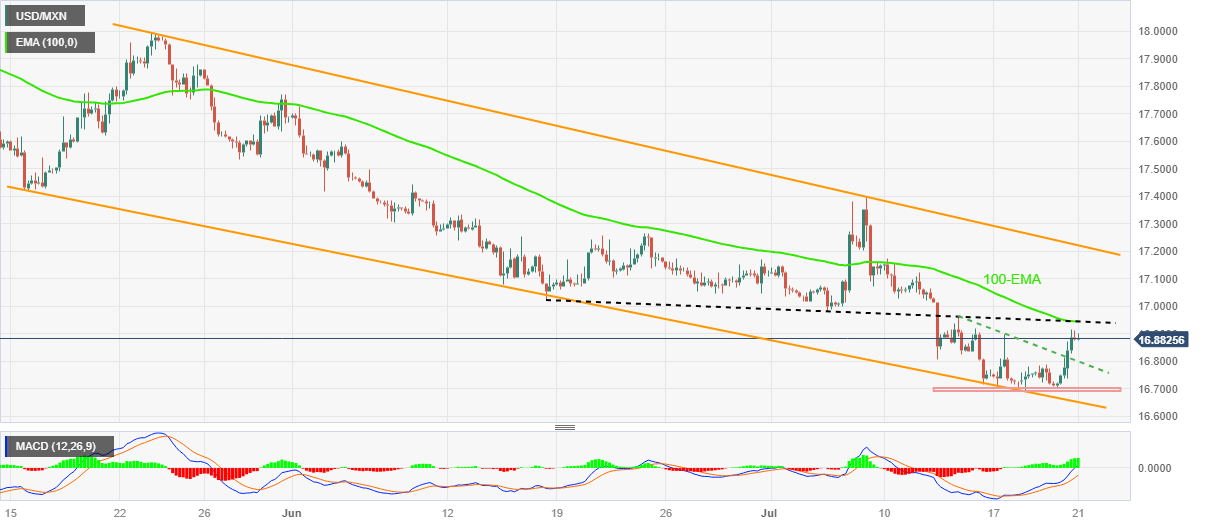
USD/MXN bulls take a breather around 16.88 amid early Friday morning in Europe, after rising the most in two weeks. In doing so, the Mexican Peso (MXN) pair cheered the upside beak of a one-week-old descending trend line, as well as the bullish MACD signals.

However, a convergence of the previous support line from mid-June and the 100-bar Exponential Moving Average (EMA), around 16.95 at the latest, restricts the immediate recovery of the USD/MXN pair.

Above all, USD/MXN buyers remain off the table unless posting a successful upside break of the 10-week-old bearish channel’s top line, close to 17.22 at the latest.

Even so, the monthly high of 17.40 will act as the last defense of the USD/MXN bears.

On the flip side, the previous resistance line from July 13, close to 16.80, limits immediate USD/MXN downside during a fresh pullback.

Following that, a one-week-old horizontal support zone and bottom line of the stated channel, respectively near 16.70 and 16.65, will be crucial to watch for clear directions.

Should the Mexican Peso fail to recover from 16.65, the odds of witnessing a slump toward the October 2015 low of 16.32 can’t be ruled out.

USD/MXN: Four-hour chart

Trend: Limited upside expected

Additional important levels

Overview
Today last price 16.8827
Today Daily Change -0.0073
Today Daily Change % -0.04%
Today daily open 16.89
 
Trends
Daily SMA20 16.9958
Daily SMA50 17.2808
Daily SMA100 17.7278
Daily SMA200 18.4819
 
Levels
Previous Daily High 16.9154
Previous Daily Low 16.7032
Previous Weekly High 17.1746
Previous Weekly Low 16.7167
Previous Monthly High 17.7286
Previous Monthly Low 17.0243
Daily Fibonacci 38.2% 16.8344
Daily Fibonacci 61.8% 16.7843
Daily Pivot Point S1 16.7571
Daily Pivot Point S2 16.6241
Daily Pivot Point S3 16.5449
Daily Pivot Point R1 16.9692
Daily Pivot Point R2 17.0484
Daily Pivot Point R3 17.1814


Share: Feed news

Information on these pages contains forward-looking statements that involve risks and uncertainties. Markets and instruments profiled on this page are for informational purposes only and should not in any way come across as a recommendation to buy or sell in these assets. You should do your own thorough research before making any investment decisions. FXStreet does not in any way guarantee that this information is free from mistakes, errors, or material misstatements. It also does not guarantee that this information is of a timely nature. Investing in Open Markets involves a great deal of risk, including the loss of all or a portion of your investment, as well as emotional distress. All risks, losses and costs associated with investing, including total loss of principal, are your responsibility. The views and opinions expressed in this article are those of the authors and do not necessarily reflect the official policy or position of FXStreet nor its advertisers. The author will not be held responsible for information that is found at the end of links posted on this page.

If not otherwise explicitly mentioned in the body of the article, at the time of writing, the author has no position in any stock mentioned in this article and no business relationship with any company mentioned. The author has not received compensation for writing this article, other than from FXStreet.

FXStreet and the author do not provide personalized recommendations. The author makes no representations as to the accuracy, completeness, or suitability of this information. FXStreet and the author will not be liable for any errors, omissions or any losses, injuries or damages arising from this information and its display or use. Errors and omissions excepted.

The author and FXStreet are not registered investment advisors and nothing in this article is intended to be investment advice.

Recommended content


Recommended content

Editors’ Picks

EUR/USD retreats from daily highs, holds above 1.0800

EUR/USD retreats from daily highs, holds above 1.0800

EUR/USD loses traction but holds above 1.0800 after touching its highest level in three weeks above 1.0840. Nonfarm Payrolls in the US rose more than expected in June but downward revisions to May and April don't allow the USD to gather strength.

EUR/USD News

GBP/USD struggles to hold above 1.2800 after US jobs data

GBP/USD struggles to hold above 1.2800 after US jobs data

GBP/USD spiked above 1.2800 with the immediate reaction to the mixed US jobs report but retreated below this level. Nonfarm Payrolls in the US rose 206,000 in June. The Unemployment Rate ticked up to 4.1% and annual wage inflation declined to 3.9%. 

GBP/USD News

Gold approaches $2,380 on robust NFP data

Gold approaches $2,380 on robust NFP data

Gold intensifies the bullish stance for the day, rising to the vicinity of the $2,380 region following the publication of the US labour market report for the month of June. The benchmark 10-year US Treasury bond yield stays deep in the red near 4.3%, helping XAU/USD push higher.

Gold News

Crypto Today: Bitcoin, Ethereum and Ripple lose key support levels, extend declines on Friday

Crypto Today: Bitcoin, Ethereum and Ripple lose key support levels, extend declines on Friday

Crypto market lost nearly 6% in market capitalization, down to $2.121 trillion. Bitcoin (BTC), Ethereum (ETH) and Ripple (XRP) erased recent gains from 2024. 

Read more

French Elections Preview: Euro to “sell the fact” on a hung parliament scenario Premium

French Elections Preview: Euro to “sell the fact” on a hung parliament scenario

Investors expect Frances's second round of parliamentary elections to end with a hung parliament. Keeping extremists out of power is priced in and could result in profit-taking on Euro gains. 

Read more

Forex MAJORS

Cryptocurrencies

Signatures