|

USD/MXN Price Analysis: Divergence between price action and RSI warrants further upside

  • USD/MXN jumps from YTD lows around $18.33 and climbs to 18.40.
  • USD/MXN Price Analysis: Positive divergence remains, which could pave the way for a recovery.

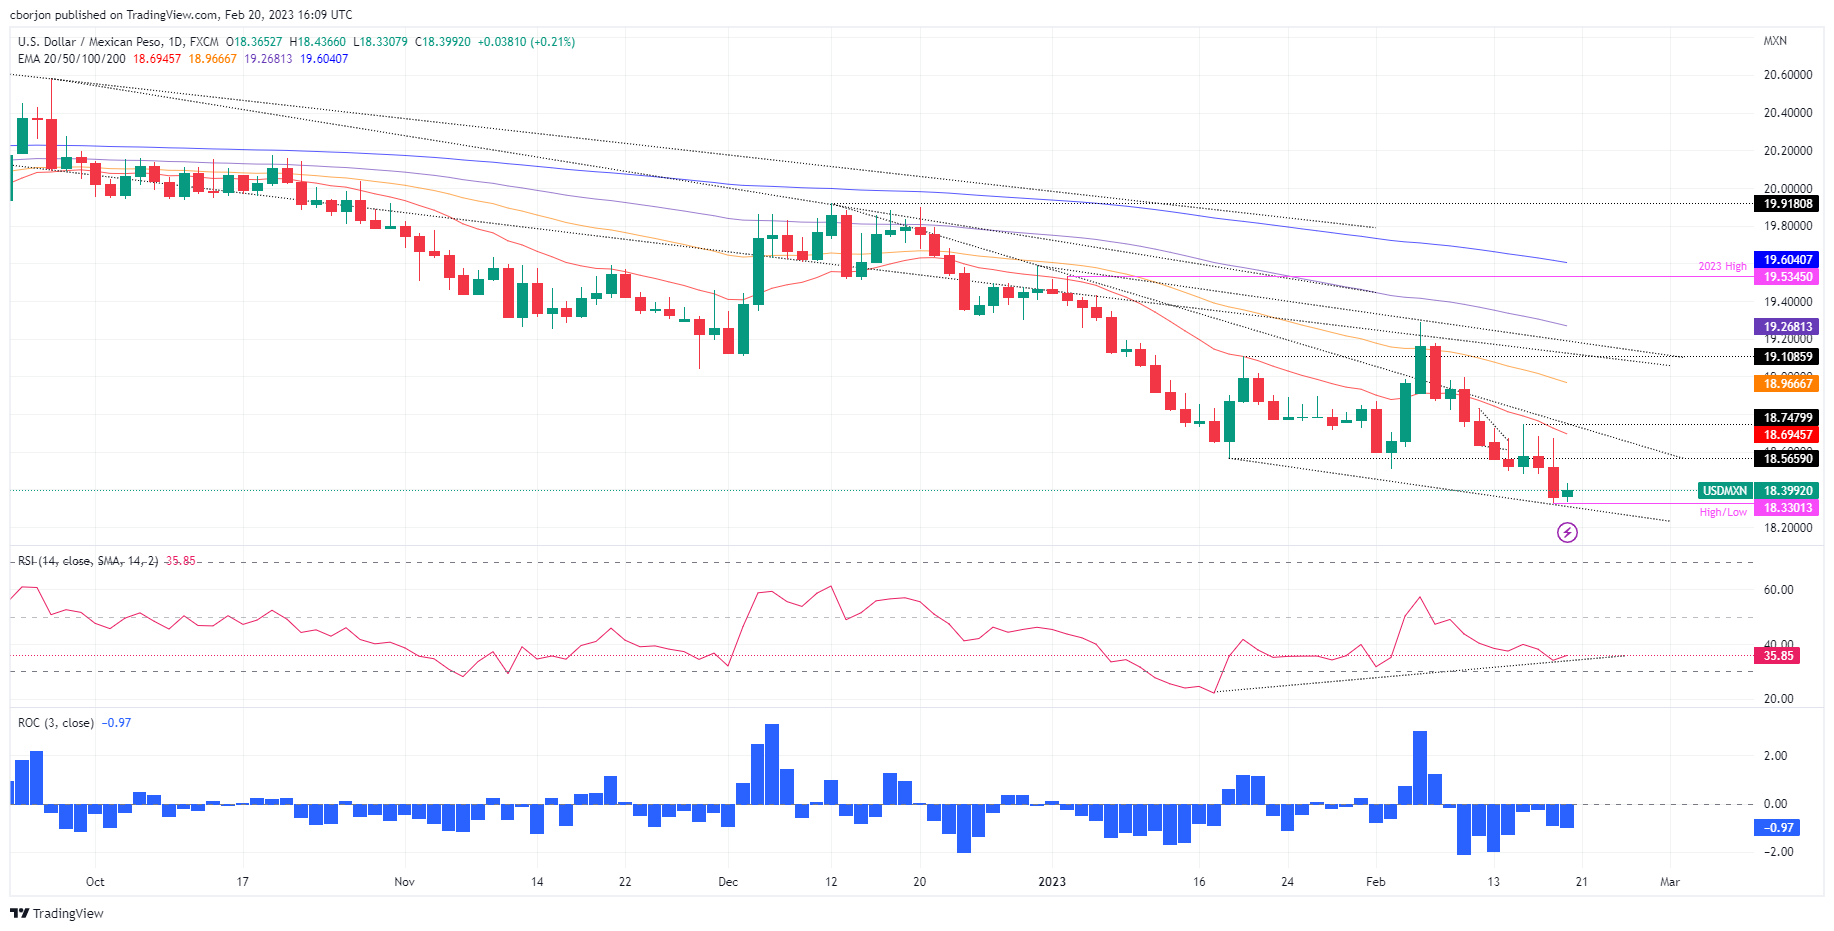
The USD/MXN bounces after hitting multi-year lows around 18.3301, snapping three days of consecutive losses. Nevertheless, the USD/MXN would remain pressured after a strong downtrend dragged prices from the last year's $21.05 peak toward the above-mentioned $18.33 area. At the time of writing, the USD/MXN exchanges hand at 18.4076, above its opening price by 0.25%.

Technically speaking, the USD/MXN daily chart portrays a bearish continuation as the most likely scenario. However, the divergence between the USD/MXN price action and the Relative Strength Index (RSI) remains intact, which would spur a reversal that might open the door for the USD/MXN buyers to reclaim the $19.00 psychological level. This means as price action registered lower lows, the RSI has not. Therefore, risks for a reversal remain, which would open the door for further USD/MXN upside.

For that scenario to play out, the USD/MXN needs to crack the confluence of a downslope-resistance trendline and the 20-day Exponential Moving Average (EMA) at 18.6951, followed by the February 15 daily high at 18.7479, followed by the 50-day EMA At 18.9669, ahead of the 19.0000 psychological price level.

The USD/MXN must conquer the 18.4000 mark for a bearish continuation. Once cleared, that will expose the YTD low at 18.3301, followed by the psychological $18.00.

USD/MXN Daily chart

USD/MXN Key technical levels

USD/MXN

Overview
Today last price18.4014
Today Daily Change0.0438
Today Daily Change %0.24
Today daily open18.3576
 
Trends
Daily SMA2018.74
Daily SMA5019.0894
Daily SMA10019.3895
Daily SMA20019.7607
 
Levels
Previous Daily High18.6756
Previous Daily Low18.3306
Previous Weekly High18.754
Previous Weekly Low18.3306
Previous Monthly High19.5361
Previous Monthly Low18.5663
Daily Fibonacci 38.2%18.4623
Daily Fibonacci 61.8%18.5438
Daily Pivot Point S118.2336
Daily Pivot Point S218.1096
Daily Pivot Point S317.8886
Daily Pivot Point R118.5785
Daily Pivot Point R218.7995
Daily Pivot Point R318.9235

Author

Christian Borjon Valencia

Christian Borjon began his career as a retail trader in 2010, mainly focused on technical analysis and strategies around it. He started as a swing trader, as he used to work in another industry unrelated to the financial markets.

More from Christian Borjon Valencia
Share:

Markets move fast. We move first.

Orange Juice Newsletter brings you expert driven insights - not headlines. Every day on your inbox.

By subscribing you agree to our Terms and conditions.

Editor's Picks

EUR/USD clings to small gains near 1.1750

Following a short-lasting correction in the early European session, EUR/USD regains its traction and clings to moderate gains at around 1.1750 on Monday. Nevertheless, the pair's volatility remains low, with investors awaiting this weeks key data releases from the US and the ECB policy announcements.

GBP/USD edges higher toward 1.3400 ahead of US data and BoE

GBP/USD reverses its direction and advances toward 1.3400 following a drop to the 1.3350 area earlier in the day. The US Dollar struggles to gather recovery momentum as markets await Tuesday's Nonfarm Payrolls data, while the Pound Sterling holds steady ahead of the BoE policy announcements later in the week.

Gold builds on previous week's gains, approaches $4,350

Gold preserves its bullish momentum after rising more than 2% last week and climbs toward $4,350 on Monday. The precious metal extends its upside as the US Dollar remains on the back foot on growing expectations for a dovish Fed policy outlook next year.

Solana consolidates as spot ETF inflows near $1 billion signal institutional dip-buying

Solana price hovers above $131 at the time of writing on Monday, nearing the upper boundary of a falling wedge pattern, awaiting a decisive breakout. On the institutional side, demand for spot Solana Exchange-Traded Funds remained firm, pushing total assets under management to nearly $1 billion since launch. 

Big week ends with big doubts

The S&P 500 continued to push higher yesterday as the US 2-year yield wavered around the 3.50% mark following a Federal Reserve (Fed) rate cut earlier this week that was ultimately perceived as not that hawkish after all. The cut is especially boosting the non-tech pockets of the market.

Solana Price Forecast: SOL consolidates as spot ETF inflows near $1 billion signal institutional dip-buying

Solana (SOL) price hovers above $131 at the time of writing on Monday, nearing the upper boundary of a falling wedge pattern, awaiting a decisive breakout.