|

USD/MXN Price Analysis: Bears need acceptance from 18.15 support confluence

  • USD/MXN remains sidelined after snapping three-day uptrend the previous day.
  • Convergence of 200-HMA, three-week-old previous resistance line puts a floor under Mexican Peso pair’s price.
  • Hesitance in extending trend line break, looming bull cross on MACD lures buyers; recovery remains elusive below 18.40.

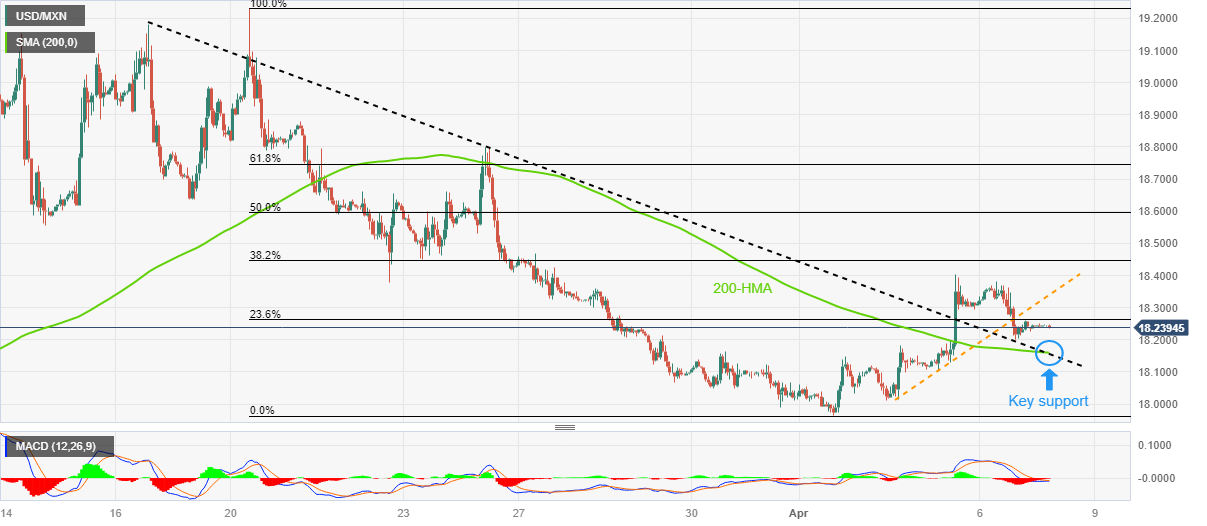
USD/MXN pair treads water around 18.23 during a sluggish start of the Good Friday holidays in major bourses. In doing so, the Mexican Peso (MXN) pair struggles to extend the previous day’s downside break of an upward-sloping trend line stretched from Tuesday.

Not only the USD/MXN pair’s resistance in extending the trend line break but an impending bull cross on the MACD indicator also challenge the sellers.

Furthermore, the 200-HMA and resistance-turned-support line from mid-March, around 18.15 by the press time, acts as a tough nut to crack for the USD/MXN bears.

In a case where the pair drops below 18.15, the odds of witnessing a fresh Year-To-Date (YTD) low, currently around 17.96, can’t be ruled out.

Meanwhile, USD/MXN recovery should initially cross the three-day-old previous support line, around 18.35 at the latest, to restore intraday buyer’s confidence.

Even so, the weekly top surrounding 18.40 can act as an extra filter towards the north before giving control to the bulls.

Following that, multiple levels near the 38.2% Fibonacci retracement of the pair’s fall from March 20 to April 03, around 18.45, can entertain the USD/MXN bulls before directing them to 18.80 and then to the 19.00 psychological magnet.

Overall, USD/MXN is yet to break the 18.15 support to convince bears. Until then, the hopes of witnessing a recovery remain on the table.

USD/MXN: Hourly chart

Trend: Recovery expected

Additional important levels

Overview
Today last price18.2401
Today Daily Change-0.0021
Today Daily Change %-0.01%
Today daily open18.2422
 
Trends
Daily SMA2018.4595
Daily SMA5018.4816
Daily SMA10018.9036
Daily SMA20019.4941
 
Levels
Previous Daily High18.381
Previous Daily Low18.2004
Previous Weekly High18.4681
Previous Weekly Low17.99
Previous Monthly High19.2324
Previous Monthly Low17.8977
Daily Fibonacci 38.2%18.2694
Daily Fibonacci 61.8%18.312
Daily Pivot Point S118.168
Daily Pivot Point S218.0939
Daily Pivot Point S317.9874
Daily Pivot Point R118.3487
Daily Pivot Point R218.4552
Daily Pivot Point R318.5293

Author

Anil Panchal

Anil Panchal

FXStreet

Anil Panchal has nearly 15 years of experience in tracking financial markets. With a keen interest in macroeconomics, Anil aptly tracks global news/updates and stays well-informed about the global financial moves and their implications.

More from Anil Panchal
Share:

Editor's Picks

EUR/USD trims gains, hovers around 1.1900 post-US data

EUR/USD trades slightly on the back foot around the 1.1900 region in a context dominated by the resurgence of some buying interest around the US Dollar on turnaround Tuesday. Looking at the US docket, Retail Sales disappointed expectations in December, while the ADP 4-Week Average came in at 6.5K.

GBP/USD comes under pressure near 1.3680

The better tone in the Greenback hurts the risk-linked complex on Tuesday, prompting GBP/USD to set aside two consecutive days of gains and trade slightly on the defensive below the 1.3700 mark. Investors, in the meantime, keep their attention on key UK data due later in the week.

Gold loses some traction, still above $5,000

Gold faces some selling pressure on Tuesday, surrendering part of its recent two-day advance although managing to keep the trade above the $5,000 mark per troy ounce. The daily pullback in the precious metal comes in response to the modest rebound in the US Dollar, while declining US Treasury yields across the curve seem to limit the downside.

XRP holds $1.40 amid ETF inflows and stable derivatives market

Ripple trades under pressure, with immediate support at $1.40 holding at the time of writing on Tuesday. A recovery attempt from last week’s sell-off to $1.12 stalled at $1.54 on Friday, leading to limited price action between the current support and the resistance.

Dollar drops and stocks rally: The week of reckoning for US economic data

Following a sizeable move lower in US technology Stocks last week, we have witnessed a meaningful recovery unfold. The USD Index is in a concerning position; the monthly price continues to hold the south channel support.

Bitcoin Cash trades lower, risks dead-cat bounce amid bearish signals

Bitcoin Cash (BCH) trades in the red below $522 at the time of writing on Tuesday, after multiple rejections at key resistance. BCH’s derivatives and on-chain indicators point to growing bearish sentiment and raise the risk of a dead-cat bounce toward lower support levels.