USD/MXN edges lower amid risk-off impulse due to China’s woes
- Global market sentiment remains cautious due to China’s economic slowdown, evident from recent data on retail sales, exports, and property market turmoil.
- The recent Federal Reserve minutes show a unanimous decision for a rate hike, but there’s a growing divide among board members on the pace of future hikes.
- USD/MXN dynamics are currently influenced more by the US Dollar and global sentiment, with the pair seeming to stabilize between 16.6000 and 17.0000.
The Mexican Peso (MXN) appreciates against the US Dollar (USD) after hitting a weekly low of 17.2073. However, the USD/MXN retraced below the 17.1000 figure despite US bond yields advance and global economic woes and expectations of additional tightening. The USD/MXN is trading at 17.0884, down 0.27%.
USD/MXN dips below 17.1000 despite rising US bond yields and expectations of further Fed tightening
Market sentiment is still depressed amid China’s ongoing economic slowdown, as shown by data. Retail sales slowing, exports falling, and turmoil in its property market keeps investors nervous. The Fed’s latest meeting minutes were revealed, tilted hawkish amid growing division amongst its board members.
The most recent Federal Reserve minutes indicated that board members uniformly approved a rate increase. However, a growing trend of more neutral voices expressing concerns about the potential of pushing rates excessively. This sentiment persists even though most policymakers perceive inflation risks as leaning toward the upside. Nevertheless, the officials are adopting a prudent stance when shaping monetary policy. This is evident as they emphasized their commitment to assessing the “totality” of data before making any decisions.
Still, chances for additional tightening in November increased compared to a week ago, as shown by the CME FedWatch Tool, with odds at 34.6%, above last week’s 27.8%.
Data-wise, the US Department of Labor (DoL) revealed the last week’s Initial Jobless Claims, which came at 239K below estimates of 240K. At the same, the Philadelphia Fed Manufacturing Index for August improved, with numbers hitting 12, exceeding the -10 contraction expected by analysts.
The lack of economic data on the Mexican front keeps USD/MXN traders adrift to US Dollar (USD) dynamics and market sentiment. However, it appears the pair had found a bottom at around the 16.6000/17.0000 range, awaiting a fresh catalyst.
USD/MXN Price Analysis: Technical outlook
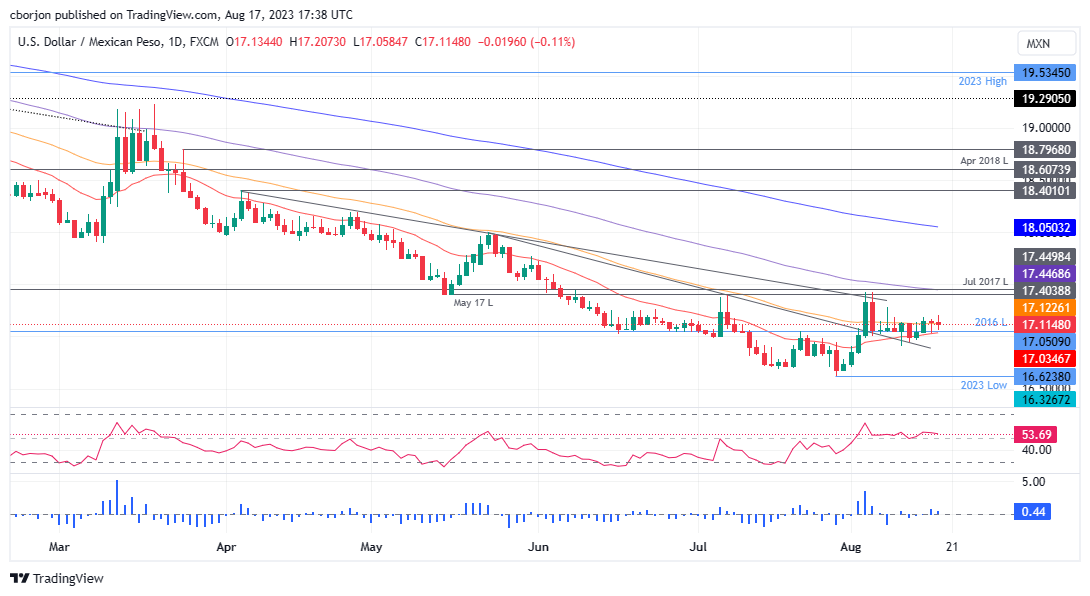
The USD/MXN daily chart portrays the pair oscillating around 17.0000, with the 20-day Moving Average (DMA) acting as support at 17.0337, while the 50-day Moving Average (DMA) stands as resistance at 17.1222. A breach of the latter, and the USD/MXN would rally towards the 100-DMA at 17.4466m ahead of the psychological 17.5000 figure. Conversely, a daily close below 17.0000 would expose the YTD low of 16.6238.
Author

Christian Borjon Valencia
FXStreet
Markets analyst, news editor, and trading instructor with over 14 years of experience across FX, commodities, US equity indices, and global macro markets.


