USD/MXN ascends on back of a strong USD due to solid US economic data
- USD/MXN trades sideways but shifts toward daily highs, with a 0.16% gain, as the US Dollar finds strength.
- A faster-than-expected GDP rise and lower Jobless Claims fuel the USD, causing US Treasury bond yields to surge.
- Anticipation of additional Fed rate hikes due to strong US economic performance affects USD/MXN.

USD/MXN traded sideways on Thursday after reaching a daily low of 17.0463, but data from the United States (US) bolstered the US Dollar, lifting the USD/MXN pair toward its daily highs. Nevertheless, as the greenback stabilized, the USD/MXN retreated from its high, exchanges hands at 17.1136, gains 0.16%.
Growing speculations for Fed tightening stirs greenback rise, underpins the USD/MXN
US economic data revealed that the country grew faster than expected, with the Gross Domestic Product (GDP) for the first quarter rising by 2.0%, above prior’s readings of 1.3%. At the same time, Initial Jobless Claims for the last week rose by 239K, below estimates of 265K, halting three consecutive reports trend of 260K plus claims, which erroneously suggested the labor market was cooling.
Consequently, US Treasury bond yields surged, with the 2-year note yield reaching 4.9%, its highest level since March 15, while the US Dollar Index (DXY), a measure of the greenback’s value against a basket of peers, advanced 0.33%, up at 103.302, a tailwind for the USD/MXN.
Given that US economic data is proving solid during the last month, expectations had grown about further tightening by the US Federal Reserve (Fed). During the Eurozone (EU) session, Fed Chair Jerome Powell crossed newswires emphasizing that the majority of the Federal Reserve Open Market Committee (FOMC) expects two additional rate hikes towards the year’s end amidst high inflation data and a tight labor market.
Odds for a 25 bps rate hike in July increased to 87%, while traders shifted their view of only one rate increase as chances for the November meeting augmented to 33.7%, according to the CME FedWatch Tool.
Across the border, Mexico’s lack of economic data keeps USD/MXN traders leaning into the US Dollar dynamics and market sentiment, which turned risk-averse after US data.
USD/MXN Price Analysis: Technical outlook
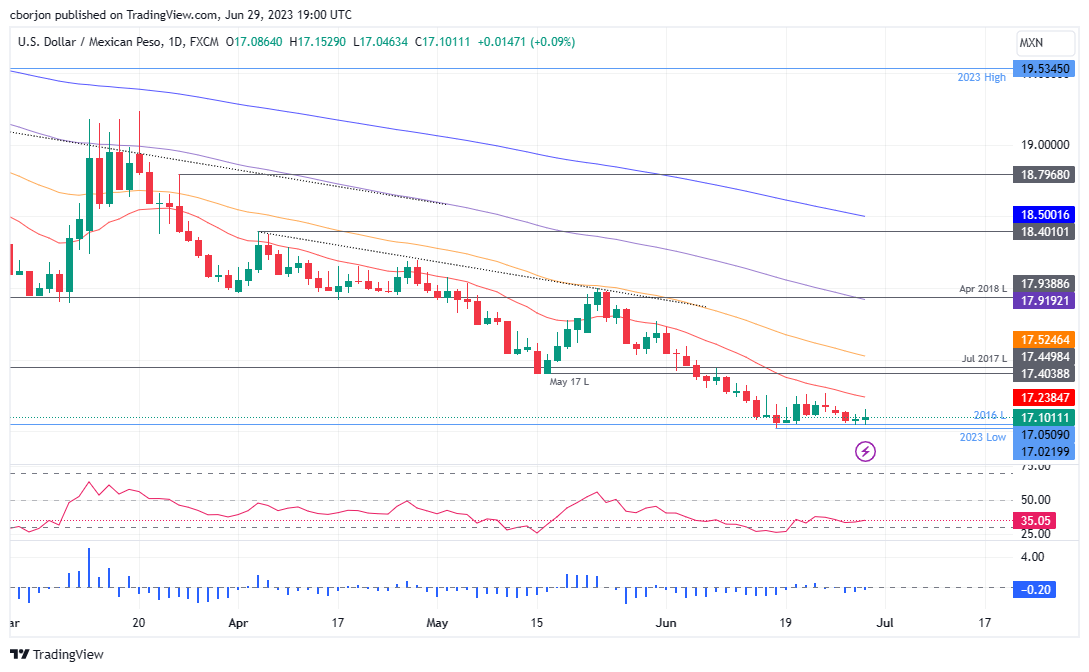
The USD/MXN is trading sideways, nearby the lows of the year, reached on June 16 at 17.0219. Even though oscillators suggest that further downside is expected, the Relative Strength Index (RSI) indicates buyers are entering the market. However, they lack the strength to lift the pair towards its most important resistance level, the May 17 daily low of 17.4039. A breach of the latter could increase buying pressure and lift the USD/MXN to test the 50-day Exponential Moving Average (EMA) at 17.5247. Otherwise, a drop below 17.1000 would keep sellers eyeing the 17.00 mark.
Author

Christian Borjon Valencia
FXStreet
Markets analyst, news editor, and trading instructor with over 14 years of experience across FX, commodities, US equity indices, and global macro markets.


