- The USD/JPY is testing the 147.00 handle ahead of Japan's latest Retail Sales print.
- Markets are forecasting a slight uptick in annualized Retail Trade in October.
- China's NBS Manufacturing PMIs due early in Asia session, to highlight market action.
The USD/JPY drifted lower in the back half of Wednesday's trading session after hitting an intraday peak just above 147.80. The pair closed out the midweek session near where it started, close to the 147.00 handle.
Japan's Retail Trade figures are due early in the Pacific trading session, and markets are forecasting a slight uptick in retail trade, with annualized Retail Trade in October expected to tick up from 5.8% to 5.9%. Japanese Industrial Production for the month of October is also expected to improve from 0.5% to 0.8%, and markets will be looking for a healthy print in Japanese Large Retailer Sales for October, which last came in at an even 5.0% in September.
Chinese NBS Purchasing Managers' Index (PMI) figures will be the highlight of the early Thursday trading window, and will set the tone for the rest of the early trading day.
Chinese PMIs are both expected to print slight gains, with the Non-Manufacturing PMI forecast to improve from 50.6 to 51.1 in November, while the headline Manufacturing PMI is expected to inch closer back towards expansionary territory, forecast to edge upwards from 49.5 to 49.7.
Later on Thursday will be another reading of the US Core Personal Consumption Expenditure (PCE) Price Index for October, and markets are expecting the Federal Reserve's (Fed) favorite inflation metric to tick down slightly from 0.3% to 0.2% in the MoM figure as inflation continues to ease back in the US domestic economy.
USD/JPY Technical Outlook
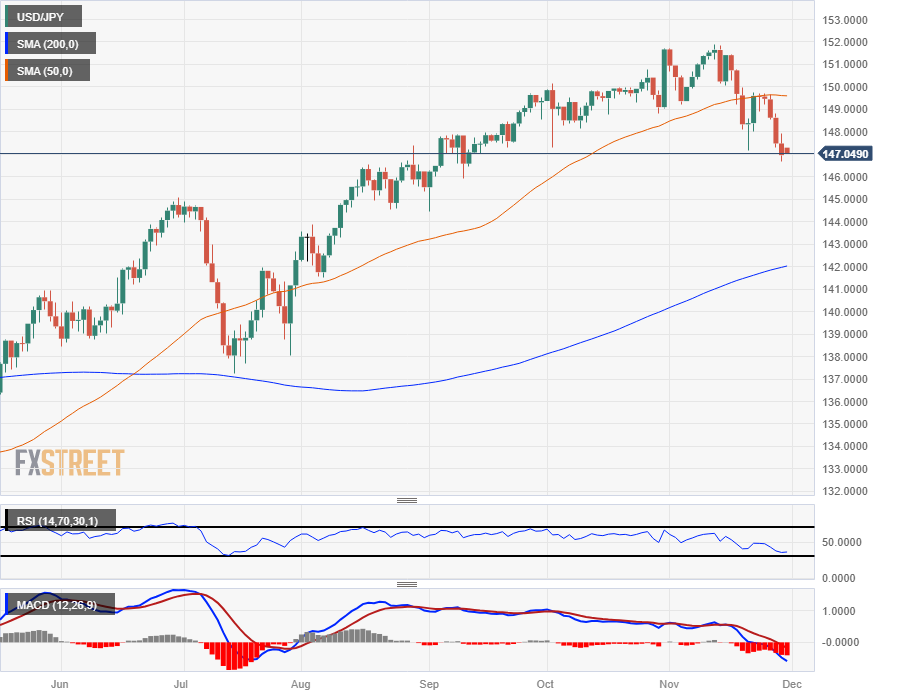
The USD/JPY's downside on Wednesday sees the pair close in the red for a fifth straight day, and the pair is continuing to drift lower after seeing a technical rejection from the 50-day Simple Moving Average (SMA) in the last swing high into 149.50.
The pair has been trading steadily lower after failing to claim the 152.00 major handle in early November's trading, and the pair is set to see technical congestion with price action trading on the south side of the 50-day SMA with long-term prices getting technical support from the 200-day SMA near 142.00.
USD/JPY Daily Chart
USD/JPY Technical Levels
Information on these pages contains forward-looking statements that involve risks and uncertainties. Markets and instruments profiled on this page are for informational purposes only and should not in any way come across as a recommendation to buy or sell in these assets. You should do your own thorough research before making any investment decisions. FXStreet does not in any way guarantee that this information is free from mistakes, errors, or material misstatements. It also does not guarantee that this information is of a timely nature. Investing in Open Markets involves a great deal of risk, including the loss of all or a portion of your investment, as well as emotional distress. All risks, losses and costs associated with investing, including total loss of principal, are your responsibility. The views and opinions expressed in this article are those of the authors and do not necessarily reflect the official policy or position of FXStreet nor its advertisers. The author will not be held responsible for information that is found at the end of links posted on this page.
If not otherwise explicitly mentioned in the body of the article, at the time of writing, the author has no position in any stock mentioned in this article and no business relationship with any company mentioned. The author has not received compensation for writing this article, other than from FXStreet.
FXStreet and the author do not provide personalized recommendations. The author makes no representations as to the accuracy, completeness, or suitability of this information. FXStreet and the author will not be liable for any errors, omissions or any losses, injuries or damages arising from this information and its display or use. Errors and omissions excepted.
The author and FXStreet are not registered investment advisors and nothing in this article is intended to be investment advice.


Recommended content
Editors’ Picks

EUR/USD keeps the range bound trade near 1.1350
After bottoming near the 1.1300 level, EUR/USD has regained upward momentum, pushing toward the 1.1350 zone following the US Dollar’s vacillating price action. Meanwhile, market participants remain closely tuned to developments in the US-China trade war.

GBP/USD still well bid, still focused on 1.3200
The Greenback's current flattish stance lends extra support to GBP/USD, pushing the pair back to around the 1.3200 level as it reaches multi-day highs amid improved risk sentiment on Monday.

Gold trades with marked losses near $3,200
Gold seems to have met some daily contention around the $3,200 zone on Monday, coming under renewed downside pressure after hitting record highs near $3,250 earlier in the day, always amid alleviated trade concerns. Declining US yields, in the meantime, should keep the downside contained somehow.

Six Fundamentals for the Week: Tariffs, US Retail Sales and ECB stand out Premium
"Nobody is off the hook" – these words by US President Donald Trump keep markets focused on tariff policy. However, some hard data and the European Central Bank (ECB) decision will also keep things busy ahead of Good Friday.

Is a recession looming?
Wall Street skyrockets after Trump announces tariff delay. But gains remain limited as Trade War with China continues. Recession odds have eased, but investors remain fearful. The worst may not be over, deeper market wounds still possible.

The Best brokers to trade EUR/USD
SPONSORED Discover the top brokers for trading EUR/USD in 2025. Our list features brokers with competitive spreads, fast execution, and powerful platforms. Whether you're a beginner or an expert, find the right partner to navigate the dynamic Forex market.