USD/JPY technical analysis: Oversold RSI favors further increase from 107.55/50
- 9-day old horizontal support-zone triggered the USD/JPY pair’s U-turn amid oversold RSI.
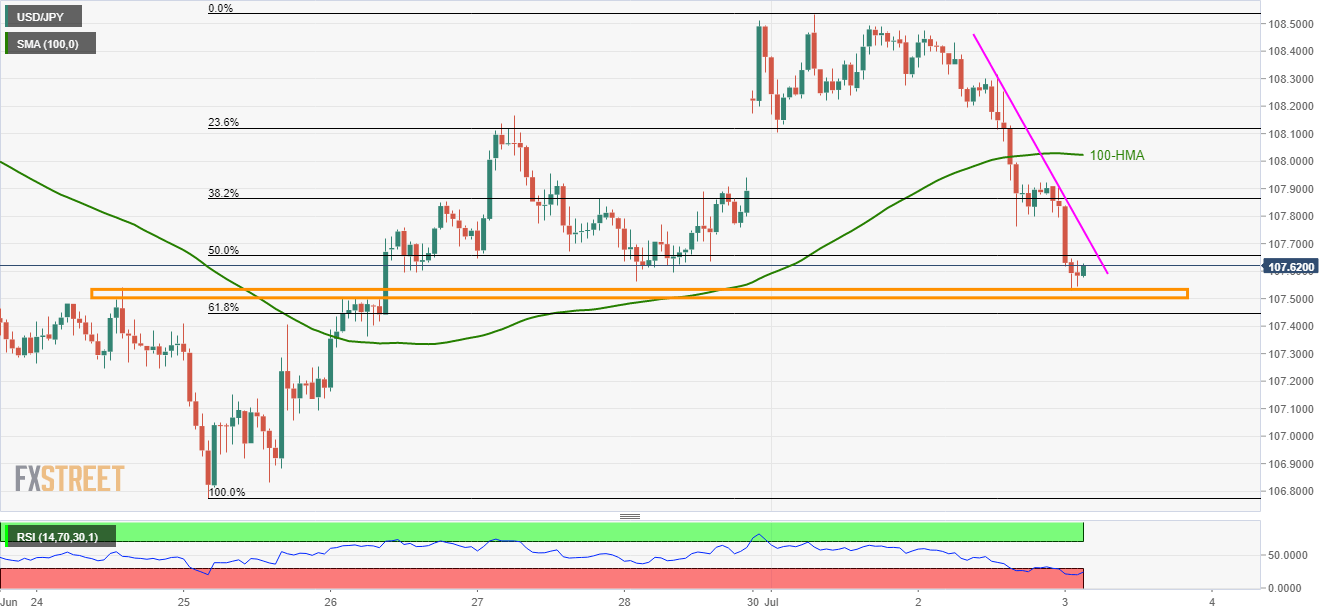
- Immediate descending trend-line, 100-HMA seem on the buyers’ radar.

Having bounced off the near-term horizontal support-zone, amid oversold RSI, the USD/JPY pair takes the bids to 107.62 during early Wednesday.
A 2-day old descending trend-line at 107.75 and 100-hour moving average (100-HMA) seem immediate resistances to watch whereas June 27 high around 108.17 can please the buyers then after.
Assuming the price rally beyond 108.17, current month high surrounding 108.54 and June-end tops surrounding 108.85 could be targeted if holding long positions.
Alternatively, bears’ resistance in respecting 14-bar relative strength index (RSI) highlights the importance of 107.25 and June 25 bottom close to 106.80
USD/JPY hourly chart
Trend: Pullback expected
Author

Anil Panchal
FXStreet
Anil Panchal has nearly 15 years of experience in tracking financial markets. With a keen interest in macroeconomics, Anil aptly tracks global news/updates and stays well-informed about the global financial moves and their implications.


