|

USD/JPY technical analysis: Greenback drops to daily lows, trades above the 109.00 handle

  • USD/JPY dropped to daily fresh daily lows however still holding onto weekly gains.
  • The level to beat for buyers is the 109.29 resistance.
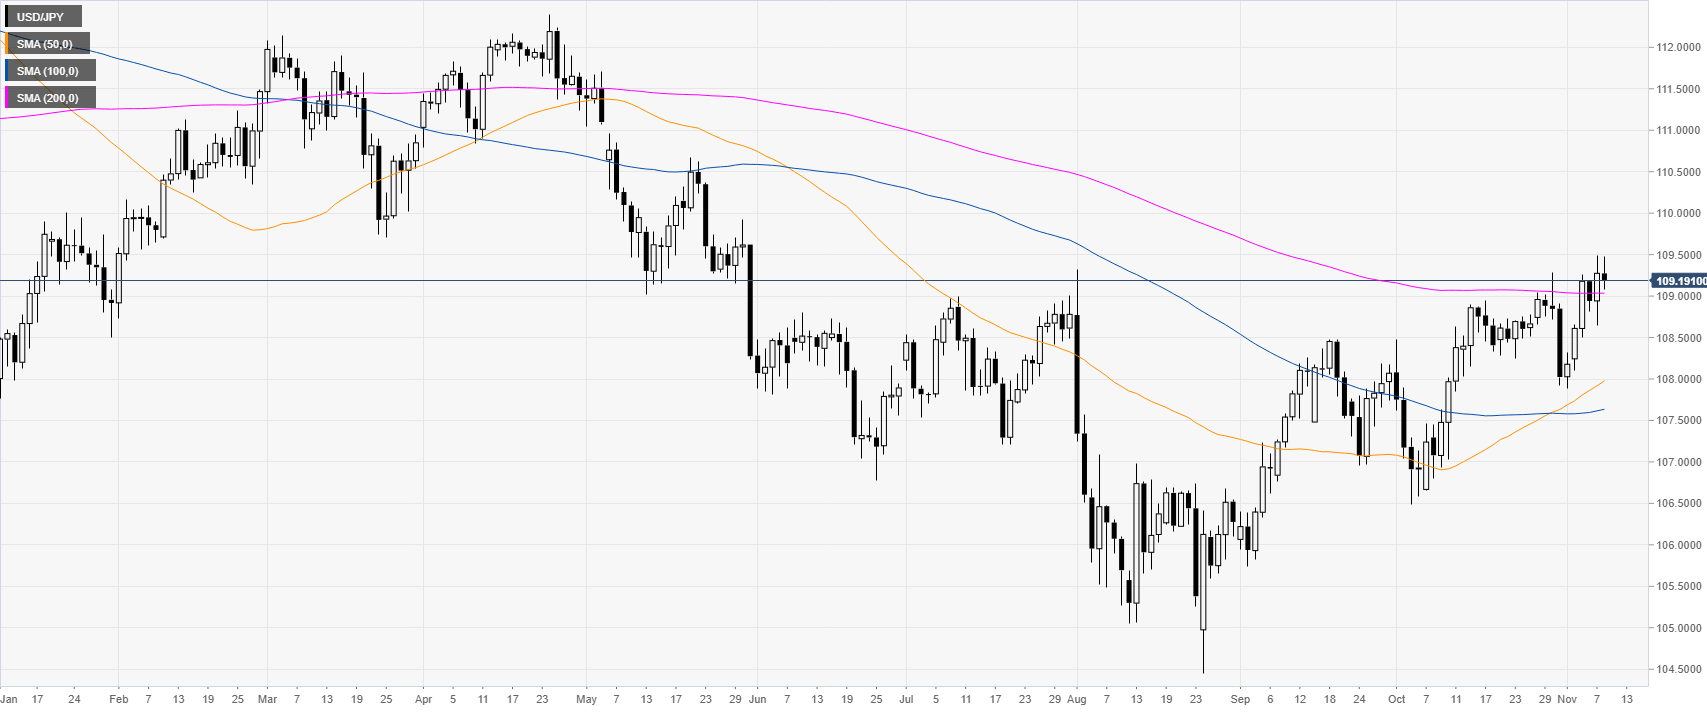


USD/JPY daily chart

 
USD/JPY is trading above the 109.00 handle and the 200-day simple moving average (SMA) on the daily chart. In the last two months the market has been gaining considerable momentum. 
 

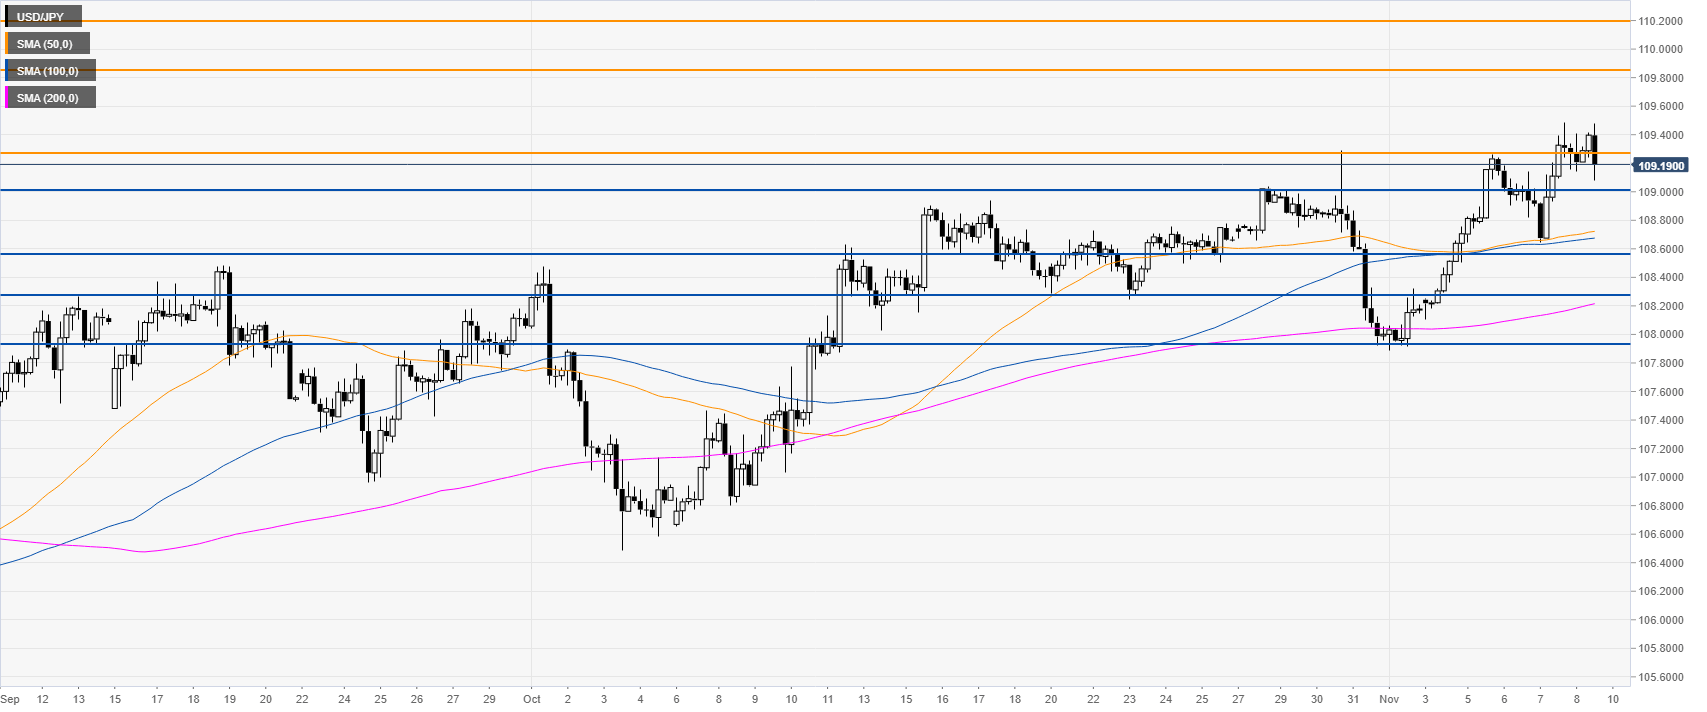
USD/JPY four-hour chart

 
The spot is trading above its main SMAs on the four-hour chart, suggesting a bullish bias in the medium term. The market is battling with the 109.29 resistance, now trading just below it. Resistances on the way up are seen at the 109.85 and 110.20 price levels, according to the Technical Confluences Indicator. 
 

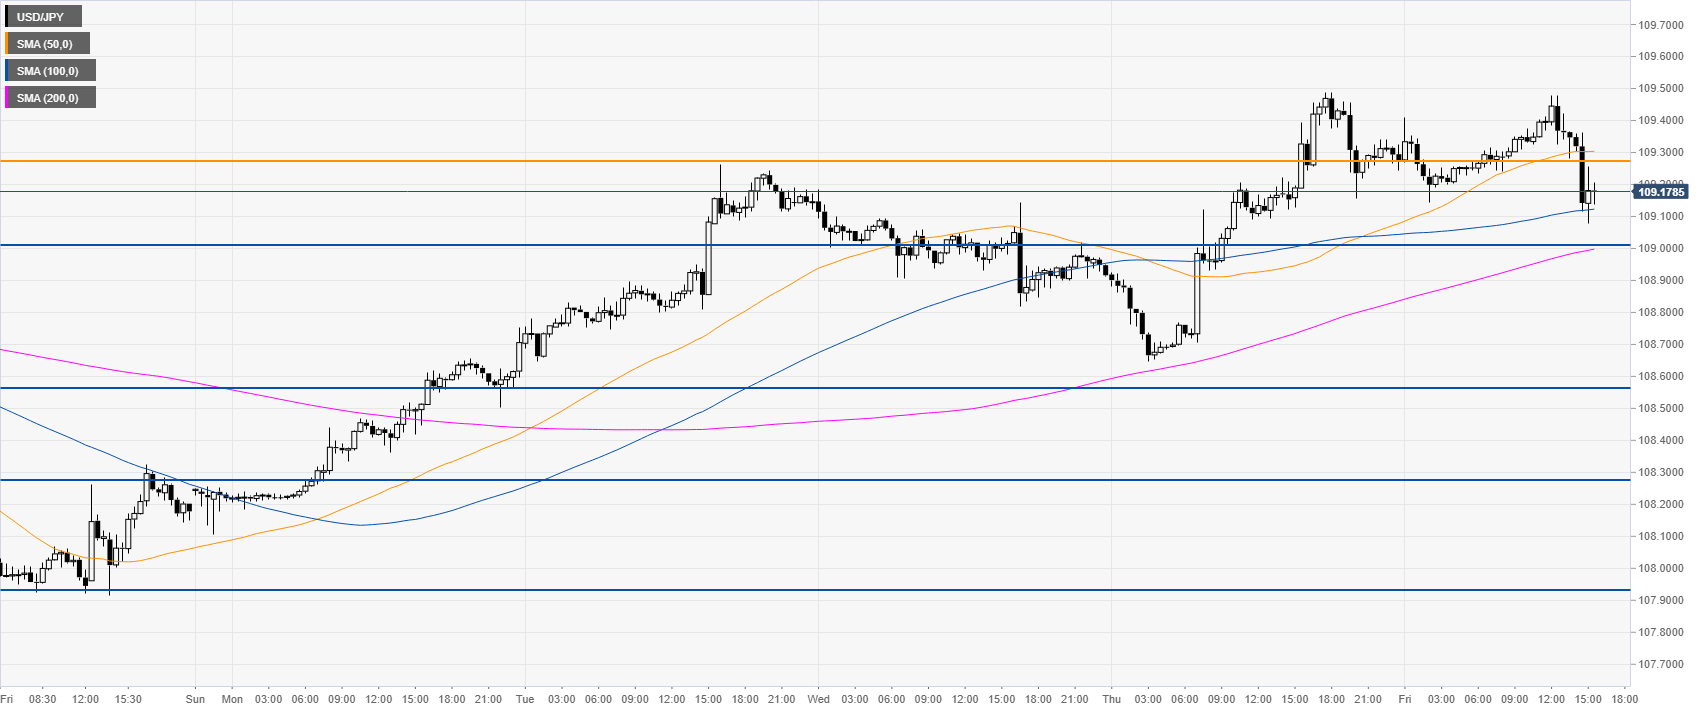
USD/JPY 30-minute chart

 
USD/JPY is trading above the upward sloping 100 and 200 SMAs, suggesting a bullish momentum in the near term. Support is seen at the 109.00 figure followed by the 108.55 and 108.27 levels, according to the Technical Confluences Indicator. 
 

Additional key levels

USD/JPY

Overview
Today last price109.19
Today Daily Change-0.08
Today Daily Change %-0.07
Today daily open109.27
 
Trends
Daily SMA20108.67
Daily SMA50107.92
Daily SMA100107.62
Daily SMA200109.04
 
Levels
Previous Daily High109.49
Previous Daily Low108.65
Previous Weekly High109.29
Previous Weekly Low107.89
Previous Monthly High109.29
Previous Monthly Low106.48
Daily Fibonacci 38.2%109.17
Daily Fibonacci 61.8%108.97
Daily Pivot Point S1108.78
Daily Pivot Point S2108.29
Daily Pivot Point S3107.94
Daily Pivot Point R1109.63
Daily Pivot Point R2109.98
Daily Pivot Point R3110.47

Author

Flavio Tosti

Flavio Tosti

Independent Analyst


More from Flavio Tosti
Share:

Editor's Picks

EUR/USD: US Dollar comeback in the makes?

The US Dollar stands victorious at the end of another week, with the EUR/USD pair trading near a four-week low of 1.1742, while the USD retains its strength despite some discouraging American data released at the end of the week. The pair edged higher on Friday, after the United States Supreme Court ruled against President Donald Trump's tariffs, although the advance is not enough to change the latest USD flow.

GBP/USD braces for more pain, as 200-day SMA tested

GBP/USD broke the previous week’s consolidation to the downside, as sellers returned with pomp, smashing the major back toward the levels last seen in late January. The pair tested bids below the 1.3450 barrier as the US Dollar strength largely played out throughout the week, while the Pound Sterling stepped back on expectations of divergent monetary policy outlooks between the Bank of England and the US Federal Reserve.

Gold climbs to weekly tops, approaches $5,100/oz

Gold keeps the bid tone well in place at the end of the week, now hitting fresh weekly highs and retargeting the key $5,100 mark per troy ounce. The move higher in the yellow metal comes in response to ongoing geopolitical tensions in the Middle East and modest losses in the US Dollar.

Week ahead: Markets brace for heightened volatility as event risk dominates

Dollar strength dominates markets as risk appetite remains subdued. A Supreme Court ruling, geopolitics and Fed developments are in focus. Pivotal Nvidia earnings on Wednesday as investors question tech sector weakness. Yen and aussie diverge; both pound and euro could recoup their losses.

Broadening drivers of growth: Unpacking GDP and looking ahead

This week’s data delivered a familiar theme with an important twist. The U.S. economy continues to be shaped by powerful forces in high-tech and AI-related investment, but recent releases suggest the growth story may finally be broadening. At the same time, trade flows are moving in a less supportive direction, reminding us that not all parts of the economy are pulling in sync.

Ripple bulls defend key support amid waning retail demand and ETF inflows

XRP ticks up above $1.40 support, but waning retail demand suggests caution. XRP attracts $4 million in spot ETF inflows on Thursday, signaling renewed institutional investor interest.