|

USD/JPY technical analysis: Challenging weekly highs ahead of the Tokyo Consumer Price Index

  • USD/JPY is challenging the weekly highs ahead of the release of the Tokyo inflation at 23:30 GMT.
  • The levels to beat for bulls are at the 106.77 and 107.07 resistances.
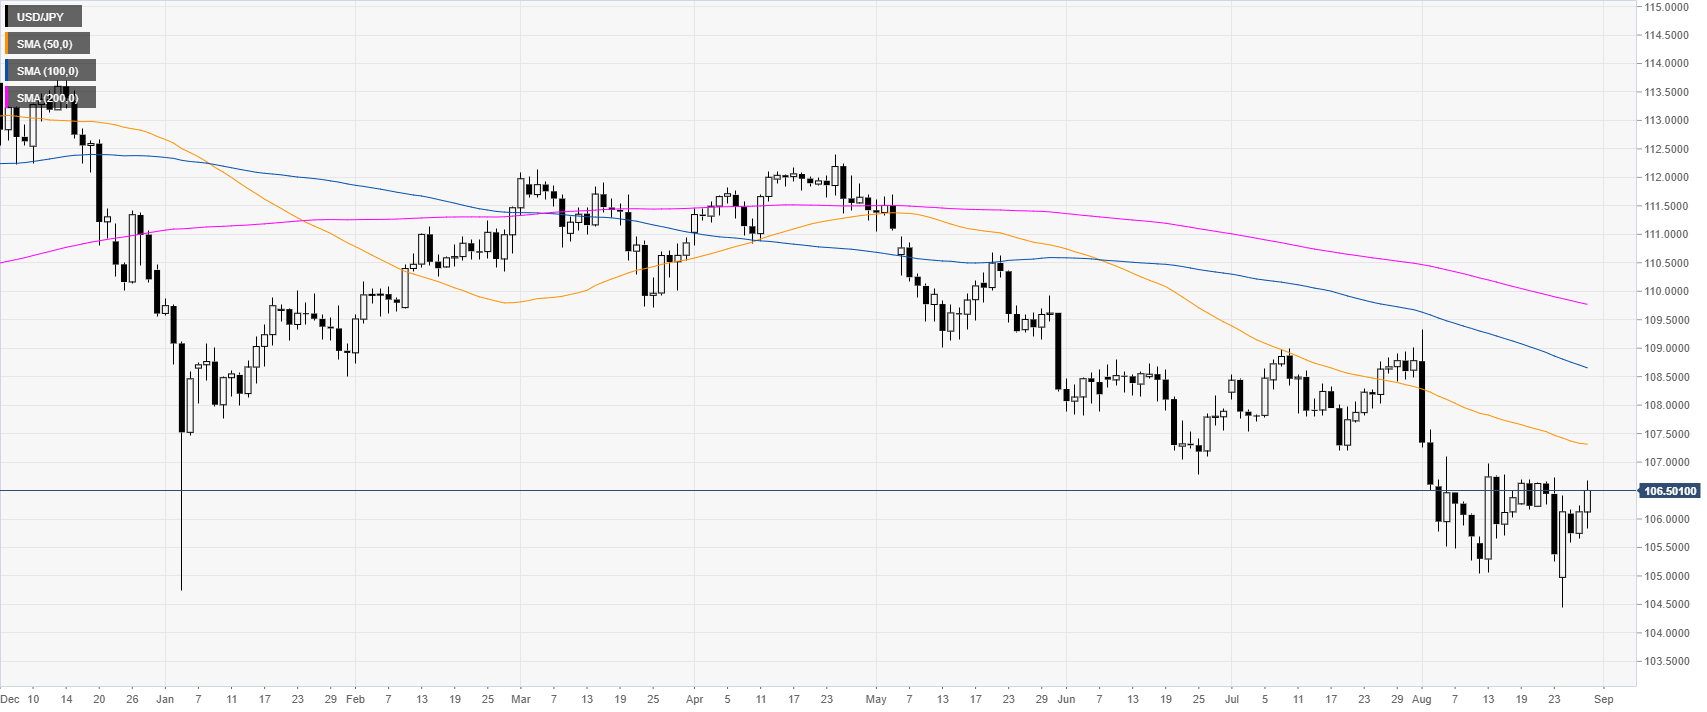
 

USD/JPY daily chart


USD/JPY is trading in the upper half of its weekly range while trading below its main daily simple moving averages (DSMAs). The market is holding above the 106.00 handle as the bear trend is currently on hold. 
 

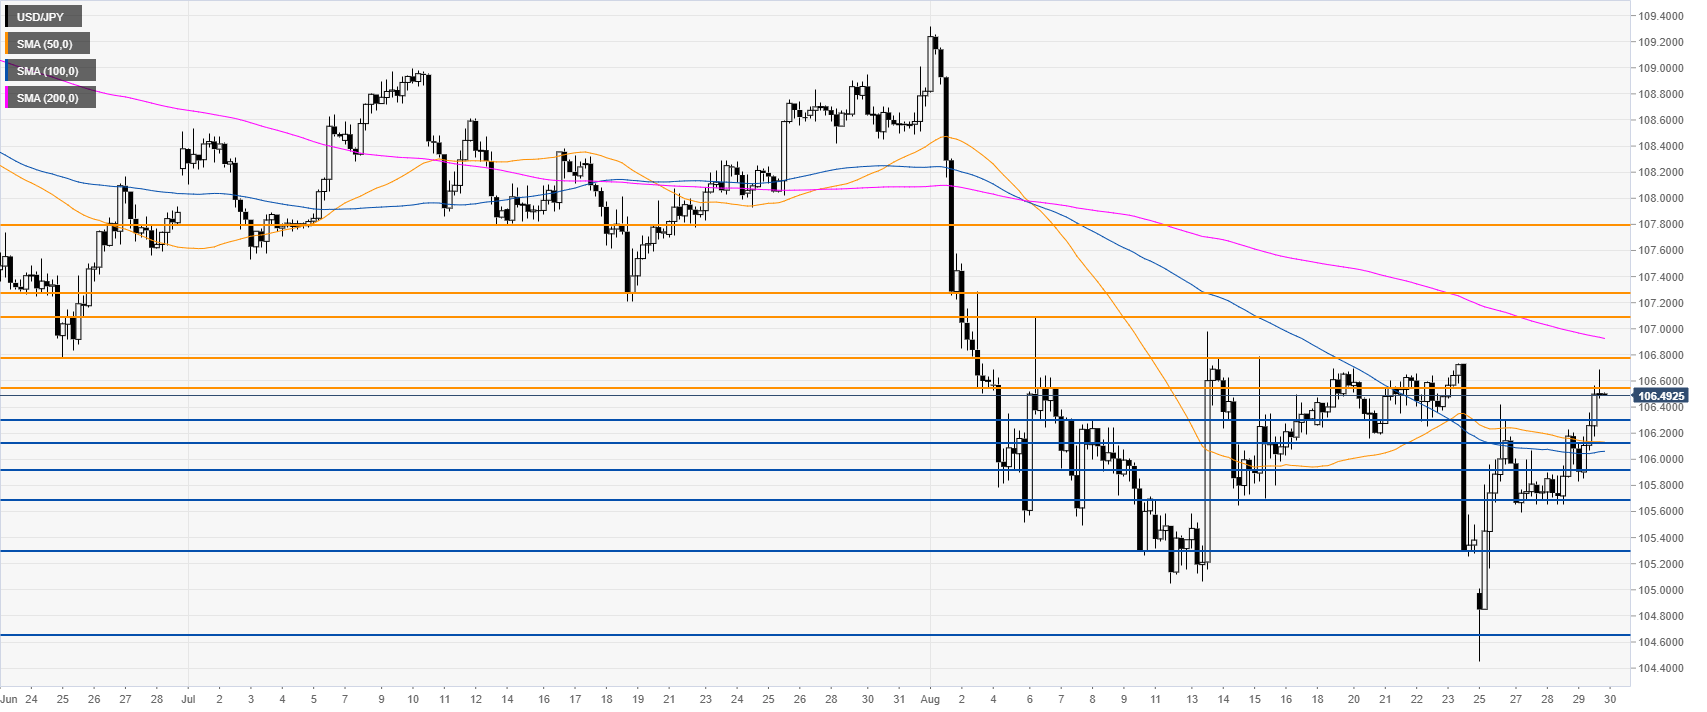
USD/JPY 4-hour chart

 
USD/JPY is challenging the 106.55 resistance. Bulls would need a daily close above 106.77 resistance to drive the market towards 107.07, 107.22 and 107.77 resistance levels, according to the Technical Confluences Indicator.
 

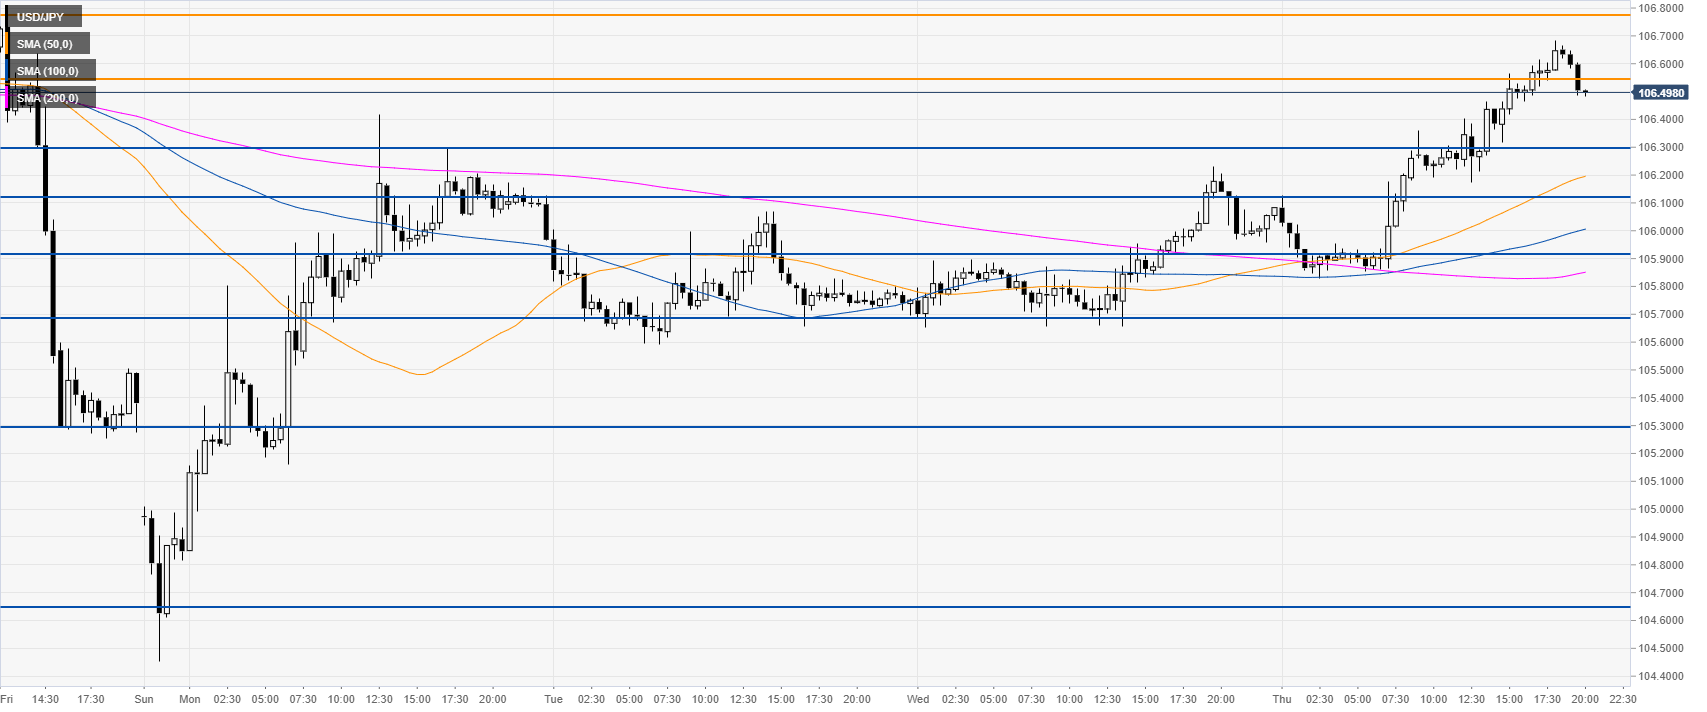
USD/JPY 30-minute chart

 
Dollar/Yen is trading above its main SMAs, suggesting bullish momentum in the near term. Immediate support is seen at 106.30, 105.12 and 105.90 according to the Technical Confluences Indicator. The Tokyo Consumer Price Index at 23:30 GMT can lead to high volatility in JPY-related pairs. 


Additional key levels

USD/JPY

Overview
Today last price106.5
Today Daily Change0.38
Today Daily Change %0.36
Today daily open106.12
 
Trends
Daily SMA20106.21
Daily SMA50107.33
Daily SMA100108.71
Daily SMA200109.8
Levels
Previous Daily High106.23
Previous Daily Low105.65
Previous Weekly High106.74
Previous Weekly Low105.26
Previous Monthly High109.01
Previous Monthly Low107.21
Daily Fibonacci 38.2%106.01
Daily Fibonacci 61.8%105.87
Daily Pivot Point S1105.77
Daily Pivot Point S2105.42
Daily Pivot Point S3105.2
Daily Pivot Point R1106.35
Daily Pivot Point R2106.58
Daily Pivot Point R3106.93

Author

Flavio Tosti

Flavio Tosti

Independent Analyst


More from Flavio Tosti
Share:

Editor's Picks

EUR/USD: Bears retain control below 1.1780-1.1770 confluence breakpoint

The EUR/USD pair remains on the back foot through the Asian session on Friday and currently trades just above mid-1.1700s, well within striking distance of a nearly one-month low set the previous day.

GBP/USD seems vulnerable near one-month low as traders await US data

The GBP/USD pair prolongs its weekly downtrend for the fifth consecutive day on Friday and slides back closer to a nearly one-month low, touched the previous day. Spot prices trade below mid-1.3400s during the Asian session on Friday and seem vulnerable to slide further as traders now look to important US macro data for a fresh impetus.

Gold eyes next breakout on US GDP, PCE inflation data

Gold sticks to recent gains around the $5,000-mark early Friday, biding time before the high-impact US macro events. The focus is now on the US fourth-quarter Gross Domestic Product, core Personal Consumption Expenditures Price Index and the Supreme Court’s ruling on President Donald Trump’s tariffs.

Bitcoin, Ethereum and Ripple remain range-bound as breakdown risks rise

Bitcoin, Ethereum, and Ripple are trading sideways within consolidation ranges on Friday, signaling a lack of directional bias in the broader crypto market. BTC rebounded from key support, and ETH is nearing the lower consolidation boundary, while XRP is holding at its lower trendline boundary. 

Hawkish Fed minutes and a market finding its footing

It was green across the board for US Stock market indexes at the close on Wednesday, with most S&P 500 names ending higher, adding 38 points (0.6%) to 6,881 overall. At the GICS sector level, energy led gains, followed by technology and consumer discretionary, while utilities and real estate posted the largest losses.

Official Trump price approaches breakout with mixed signals from traders

Official Trump (TRUMP) is trading at $3.50 at the time of writing, approaching its upper consolidation range. A breakout from this range could open the door for an upside move. On-chain data shows market indecision, with balanced flows between bulls and bears, signaling a lack of clear directional bias.