USD/JPY sticks close to 147.50 heading into the back half of the trading week
- The USD/JPY climbed a scant tenth of a percent on Wednesday, seeking higher ground.
- US ADP Employment Change missed the mark, keeping risk flows pinned closer to havens.
- Japan GDP, US NFP to close out the trading week.

The USD/JPY is seeing thin trading heading into the back half of the trading week, holding near the 147.50 level ahead of Thursday’s US Initial Jobless Claims that will give way to Friday’s Japanese Gross Domestic Product (GDP) and the latest US Nonfarm Payrolls (NFP) report that will cap off the trading week.
US Initial Jobless Claims are expected to show a slight uptick from 218K to 222K new jobless benefits seekers, and investors will be keeping eyes turned towards Friday’s NFP report, where the US is expected to see an additional 185K new jobs through November, a net increase over October’s 150K.
Japan GDP, US NFP to be the chart movers on Friday
Japanese GDP is forecast to hold steady at a -0.5% contraction for the third quarter, a steady reading with the second quarter. Annualized GDP is likewise seen holding at -2.1% for the year through the third quarter as Japan continues to grapple with a weak economy struggling to find long-run growth factors.
The University of Michigan’s US Consumer Sentiment Index for December is also printing late on Friday, and consumers are expected by median market forecasts to show an improved outlook, from 61.3 to 62.0.
US Dollar price this week
The table below shows the percentage change of US Dollar (USD) against listed major currencies this week. US Dollar was the weakest against the Japanese Yen.
| USD | EUR | GBP | CAD | AUD | JPY | NZD | CHF | |
| USD | 1.11% | 1.16% | 0.77% | 1.97% | 0.55% | 1.26% | 0.78% | |
| EUR | -1.14% | 0.09% | -0.36% | 0.83% | -0.57% | 0.14% | -0.32% | |
| GBP | -1.22% | -0.08% | -0.46% | 0.73% | -0.65% | 0.07% | -0.40% | |
| CAD | -0.74% | 0.38% | 0.44% | 1.25% | -0.20% | 0.54% | 0.05% | |
| AUD | -2.01% | -0.88% | -0.74% | -1.23% | -1.42% | -0.68% | -1.15% | |
| JPY | -0.58% | 0.55% | 0.81% | 0.24% | 1.40% | 0.70% | 0.23% | |
| NZD | -1.27% | -0.14% | -0.04% | -0.49% | 0.71% | -0.72% | -0.45% | |
| CHF | -0.82% | 0.33% | 0.42% | -0.02% | 1.19% | -0.23% | 0.48% |
The heat map shows percentage changes of major currencies against each other. The base currency is picked from the left column, while the quote currency is picked from the top row. For example, if you pick the Euro from the left column and move along the horizontal line to the Japanese Yen, the percentage change displayed in the box will represent EUR (base)/JPY (quote).
USD/JPY Technical Outlook
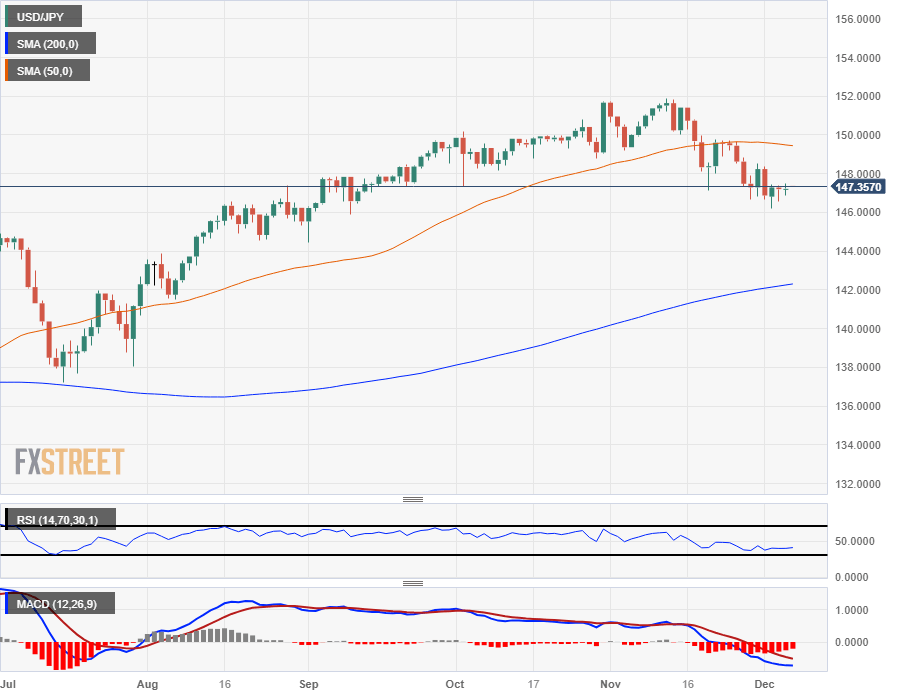
The USD/JPY is seeing thin, tight trading near the 147.50 level, with near-term bids getting propped up north of 146.00 while also constrained by the 148.00 handle to the topside.
The US Dollar has seen thin bidding since getting rejected from a bullish correction directly into the 50-day Simple Moving Average (SMA), which is currently turning bearish just below the 150.00 major handle.
To the downside, the 200-day SMA is still running far below price action, rising just beyond the 142.00 handle.
USD/JPY Daily Chart
USD/JPY Technical Levels
Author

Joshua Gibson
FXStreet
Joshua joins the FXStreet team as an Economics and Finance double major from Vancouver Island University with twelve years' experience as an independent trader focusing on technical analysis.


