|

USD/JPY Price Prediction: Potential for more downside

  • USD/JPY has pulled back after touching down on support at the 100-day SMA. 
  • The pair is in a downtrend and has broken out of a bearish pattern, raising the risk of further declines. 

USD/JPY has found support just above the 100-day Simple Moving Average (SMA) at 148.96 and bounced. 

On Monday, the pair formed an Inverted Hammer candlestick pattern and if Tuesday ends as a green up day it will gain confirmation as a near-term reversal signal. This could indicate a recovery and correction higher.

USD/JPY Daily Chart 

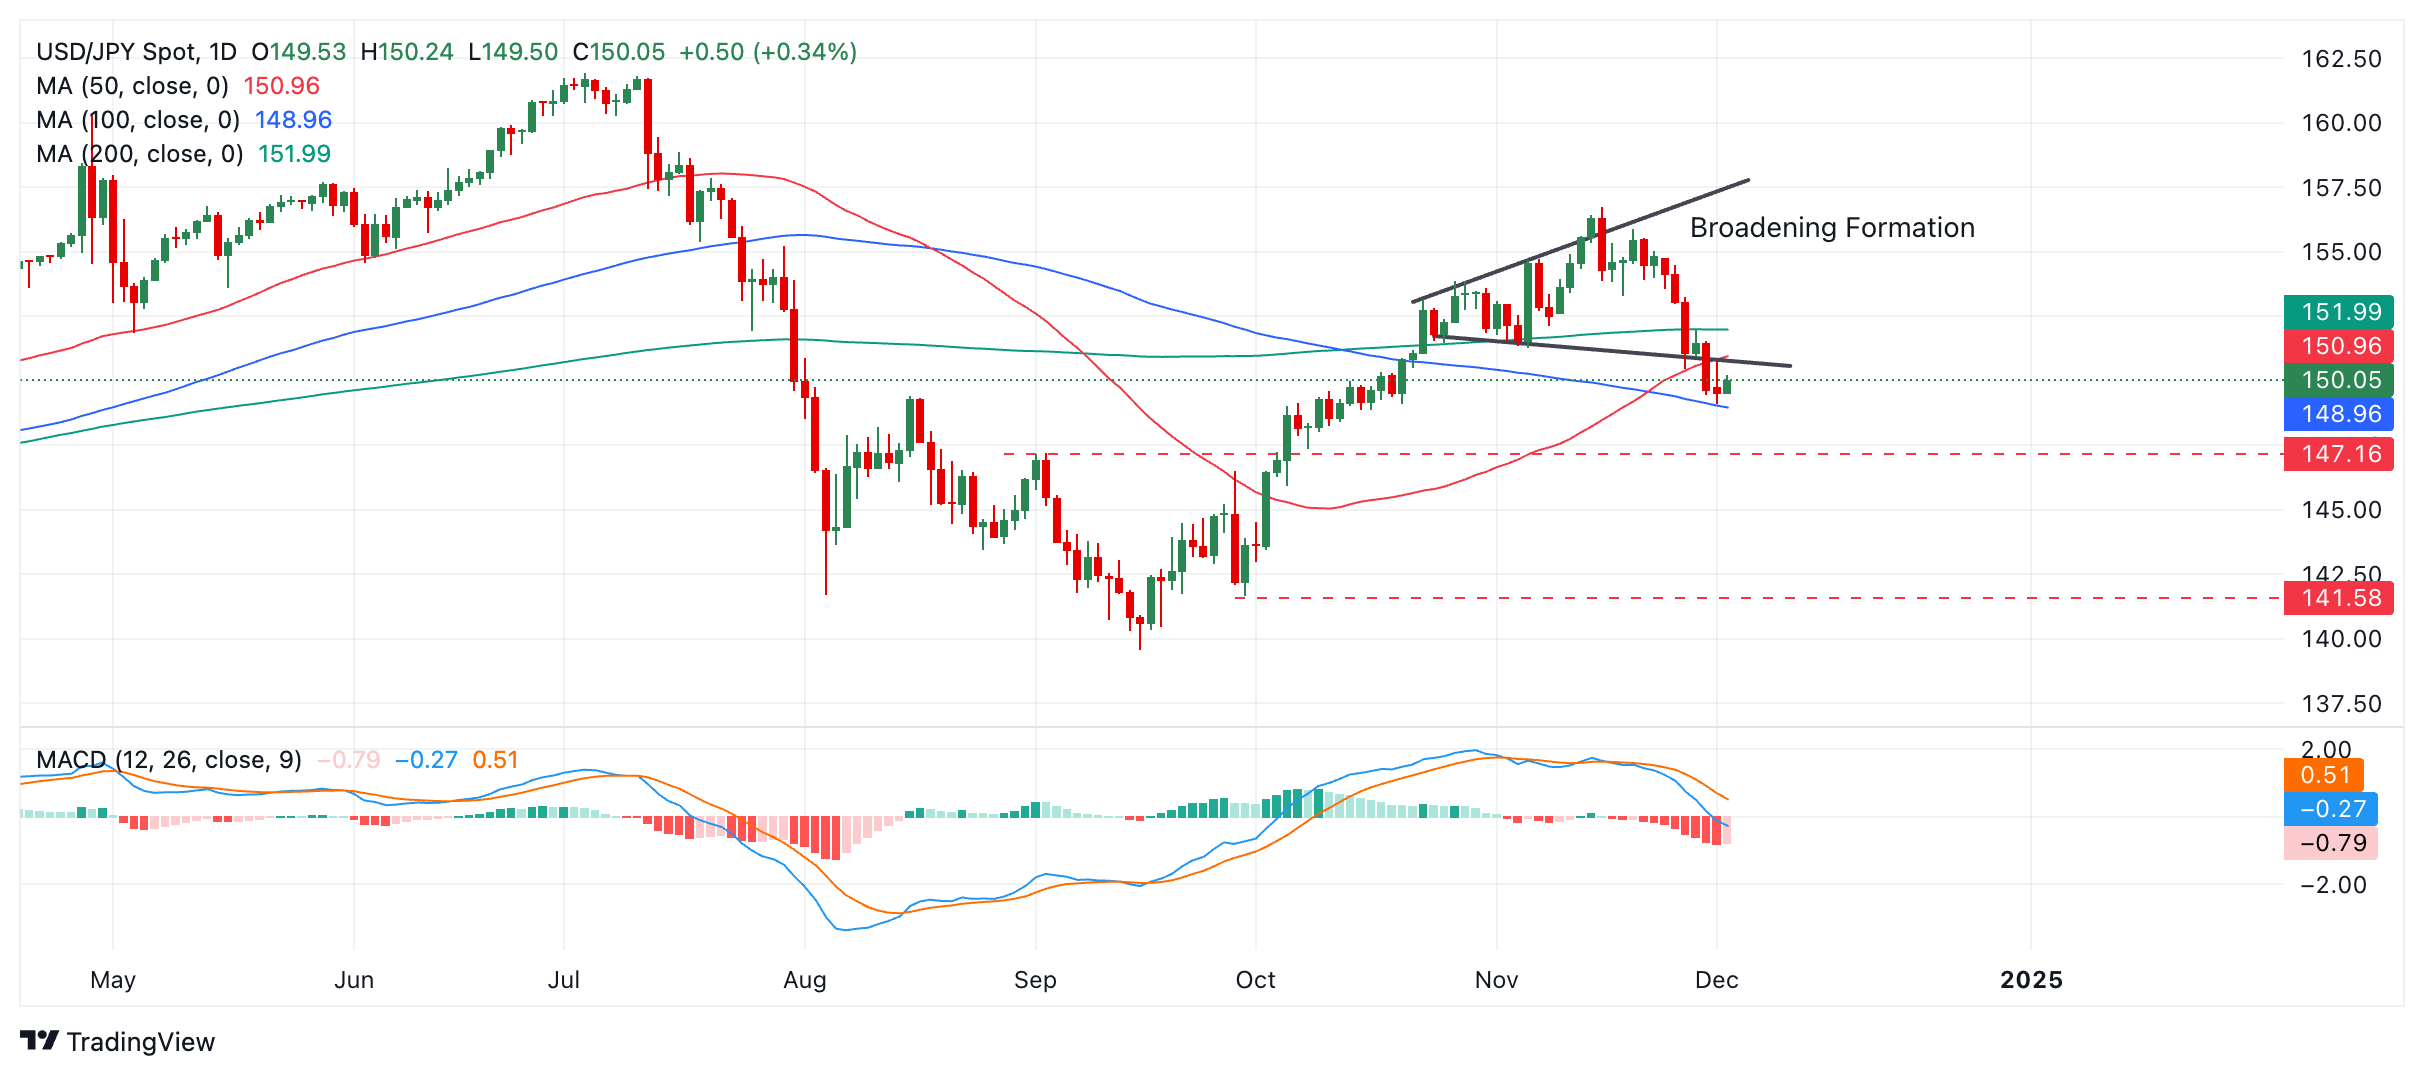
Despite the risk of a correction higher, USD/JPY remains in a downtrend on a short and medium-term basis and because of the technical analysis principle that trends tend to extend, the odds favor more downside evolving eventually.

A break below the December 2 lows at 149.08 would confirm an extension of the downtrend to the first target at around 147.92 (revised down due to pattern widening), the 61.8% Fibonacci extrapolation of the height of the bearish Broadening Formation pattern extrapolated lower. 

Further bearishness could carry USD/JPY to the next target at 147.18, the September 2, key swing high.

The (blue) Moving Average Convergence Divergence (MACD) momentum indicator is diverging away from its red signal line which is bearish and has fallen below the zero line on an intraday basis. If it closes below zero then it will increase the bearishness of the indicator reading.   

Author

Joaquin Monfort

Joaquin Monfort is a financial writer and analyst with over 10 years experience writing about financial markets and alt data. He holds a degree in Anthropology from London University and a Diploma in Technical analysis.

More from Joaquin Monfort
Share:

Editor's Picks

EUR/USD weakens to near 1.1900 as traders eye US data

EUR/USD eases to near 1.1900 in Tuesday's European trading hours, snapping the two-day winning streak. Markets turn cautious, lifting the haven demand for the US Dollar ahead of the release of key US economic data, including Retail Sales and ADP Employment Change 4-week average.

GBP/USD stays in the red below 1.3700 on renewed USD demand

GBP/USD trades on a weaker note below 1.3700 in the European session on Tuesday. The pair faces challenges due to renewed US Dollar demand, UK political risks and rising expectations of a March Bank of England rate cut. The immediate focus is now on the US Retail Sales data. 

Gold sticks to modest losses above $5,000 ahead of US data

Gold sticks to modest intraday losses through the first half of the European session, though it holds comfortably above the $5,000 psychological mark and the daily swing low. The outcome of Japan's snap election on Sunday removes political uncertainty, which along with signs of easing tensions in the Middle East, remains supportive of the upbeat market mood. This turns out to be a key factor exerting downward pressure on the safe-haven precious metal.

Bitcoin Cash trades lower, risks dead-cat bounce amid bearish signals

Bitcoin Cash trades in the red below $522 at the time of writing on Tuesday, after multiple rejections at key resistance. BCH’s derivatives and on-chain indicators point to growing bearish sentiment and raise the risk of a dead-cat bounce toward lower support levels.

Follow the money, what USD/JPY in Tokyo is really telling you

Over the past two Tokyo sessions, this has not been a rate story. Not even close. Interest rate differentials have been spectators, not drivers. What has moved USD/JPY in local hours has been flow and flow alone.

Bitcoin Cash trades lower, risks dead-cat bounce amid bearish signals

Bitcoin Cash (BCH) trades in the red below $522 at the time of writing on Tuesday, after multiple rejections at key resistance. BCH’s derivatives and on-chain indicators point to growing bearish sentiment and raise the risk of a dead-cat bounce toward lower support levels.