|

USD/JPY Price Prediction: Falling within possible bearish Broadening Formation

  • USD/JPY is declining within a potential bearish reversal pattern. 
  • Called a “Broadening Formation” such a pattern would have downside implications for price. 

USD/JPY looks like it is falling within an evolving bearish Broadening Formation price pattern (see chart below). 

If this is the case, then the pair is likely to eventually decline towards the lower boundary line of the pattern at around 151.50. After that, it could even break below that line and decline to the projected target for the actual Broadening Formation (BF) itself, at around 148.54.

USD/JPY Daily Chart 

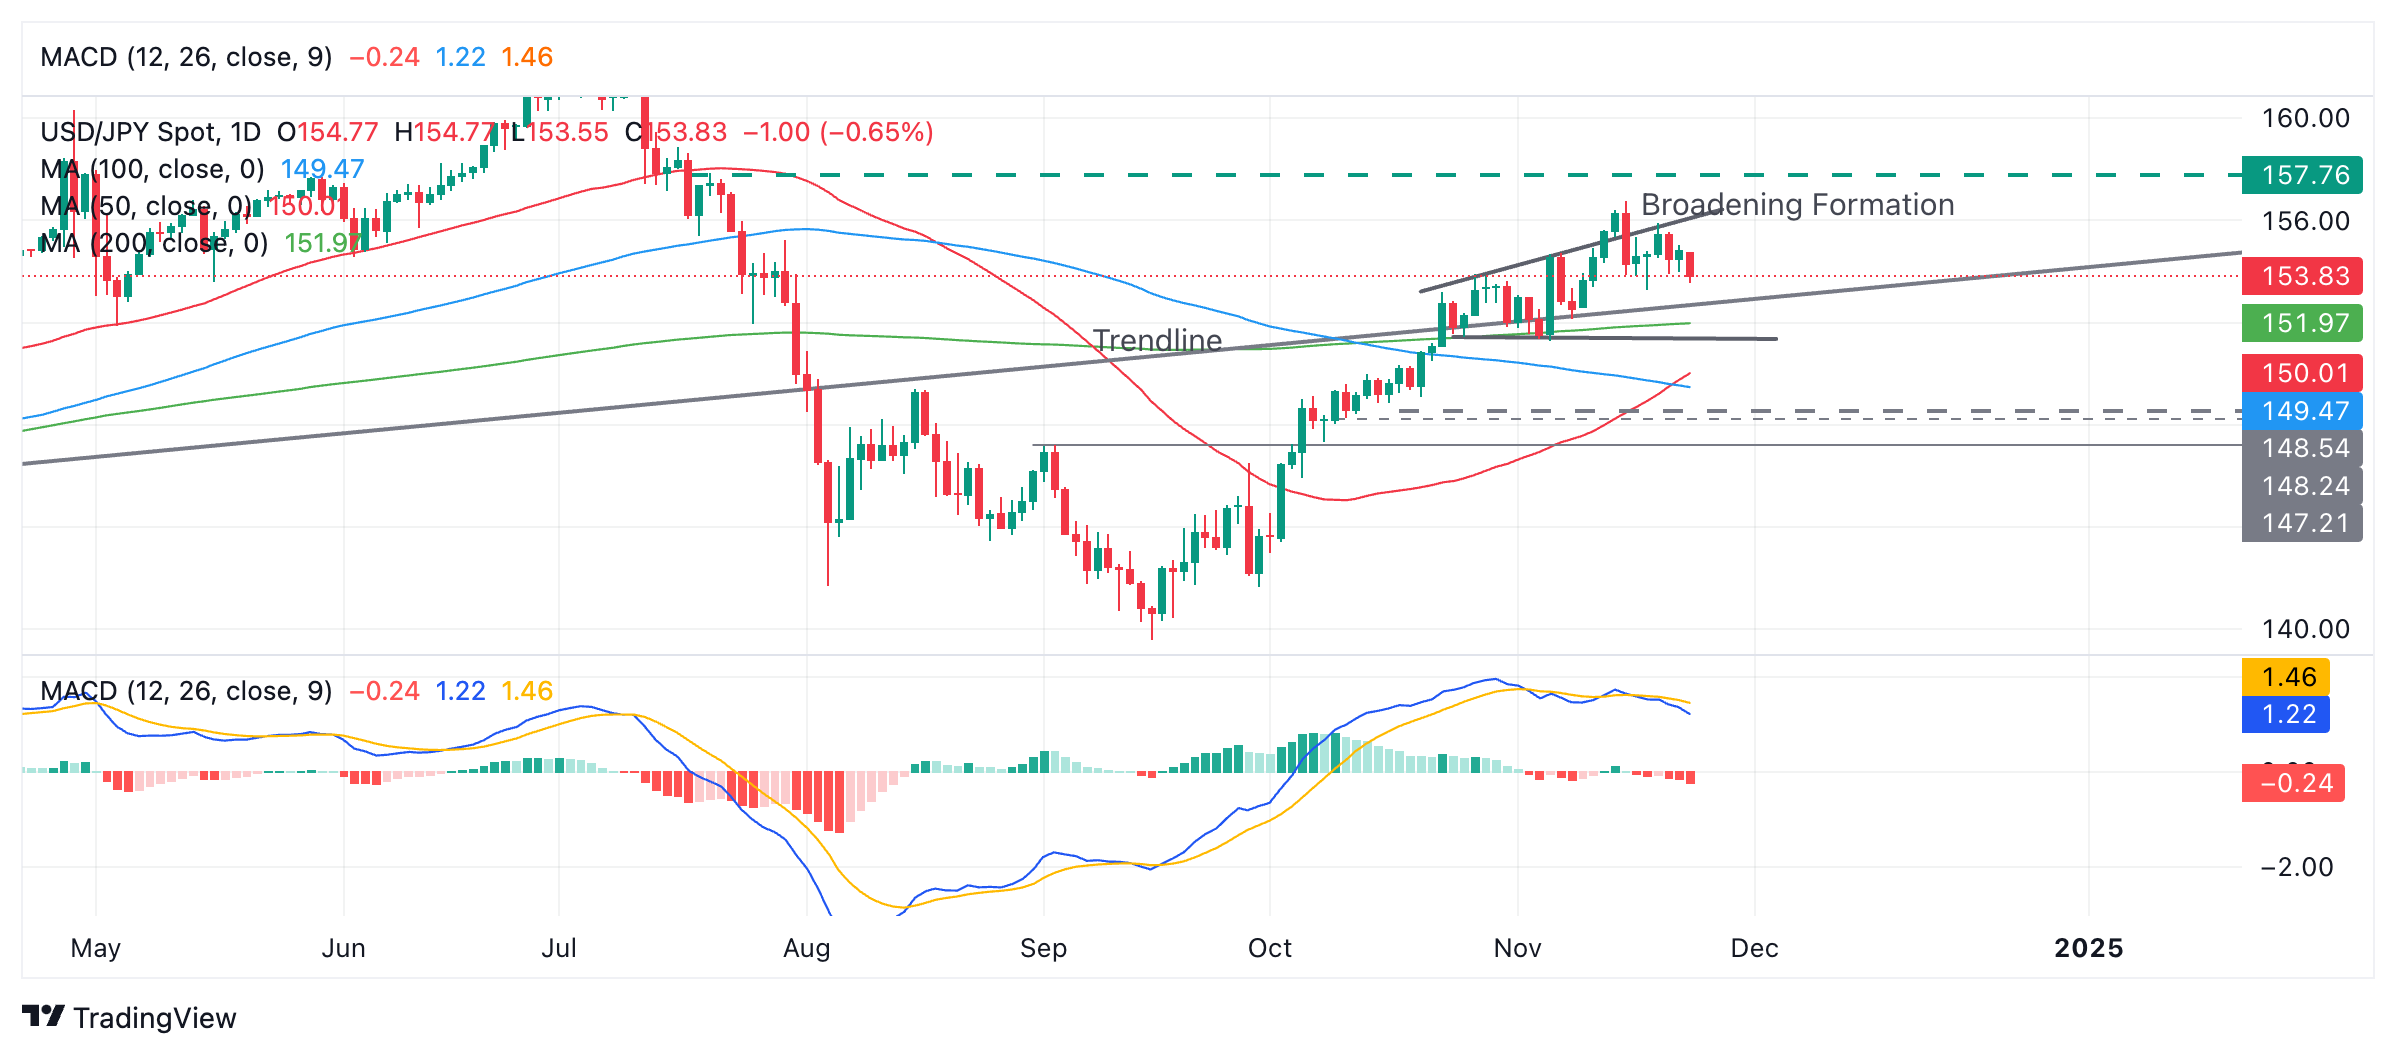
The (blue) Moving Average Convergence Divergence (MACD) is moving lower after crossing below the red signal line – a bearish indication. 

USD/JPY overshot the upper boundary line of the BF on November 14 before quickly falling back down inside it on the following day. This could was probably a sign of exhaustion and is a sign of a coming reversal on the horizon.

That said, it is also possible the pattern could be false. If so, USD/JPY would still be in a strong medium-term uptrend, and given the technical analysis principle that “the trend is your friend” the odds would favor more upside. 

In such a case, a break above 156.25 would likely confirm further gains towards a target at around 157.86 (July 19 high). 

Another possibility is that the major trendline could provide support for price in the 152.90s, slowing its decline to the lower boundary line of the BF.

Author

Joaquin Monfort

Joaquin Monfort is a financial writer and analyst with over 10 years experience writing about financial markets and alt data. He holds a degree in Anthropology from London University and a Diploma in Technical analysis.

More from Joaquin Monfort
Share:

Editor's Picks

EUR/USD flirts with daily highs, retargets 1.1900

EUR/USD regains upside traction, returning to the 1.1880 zone and refocusing its attention to the key 1.1900 barrier. The pair’s slight gains comes against the backdrop of a humble decline in the US Dollar as investors continue to assess the latest US CPI readings and the potential Fed’s rate path.

GBP/USD remains well bid around 1.3650

GBP/USD maintains its upside momentum in place, hovering around daily highs near 1.3650 and setting aside part of the recent three-day drop. Cable’s improved sentiment comes on the back of the Greenback’s  irresolute price action, while recent hawkish comments from the BoE’s Pill also collaborate with the uptick.

Gold clings to gains just above $5,000/oz

Gold is reclaiming part of the ground lost on Wednesday’s marked decline, as bargain-hunters keep piling up and lifting prices past the key $5,000 per troy ounce. The precious metal’s move higher is also underpinned by the slight pullback in the US Dollar and declining US Treasury yields across the curve.

Crypto Today: Bitcoin, Ethereum, XRP in choppy price action, weighed down by falling institutional interest 

Bitcoin's upside remains largely constrained amid weak technicals and declining institutional interest. Ethereum trades sideways above $1,900 support with the upside capped below $2,000 amid ETF outflows.

Week ahead – Data blitz, Fed Minutes and RBNZ decision in the spotlight

US GDP and PCE inflation are main highlights, plus the Fed minutes. UK and Japan have busy calendars too with focus on CPI. Flash PMIs for February will also be doing the rounds. RBNZ meets, is unlikely to follow RBA’s hawkish path.

Ripple Price Forecast: XRP potential bottom could be in sight

Ripple edges up above the intraday low of $1.35 at the time of writing on Friday amid mixed price actions across the crypto market. The remittance token failed to hold support at $1.40 the previous day, reflecting risk-off sentiment amid a decline in retail and institutional sentiment.