- USD/JPY retreats after a two-week peak of 144.68, dragged down by declining US Treasury yields.
- Technical indicators maintain a bearish stance with the pair below the Ichimoku Cloud and 200-DMA, suggesting more declines.
- Key supports identified at the September 20 low of 141.73 and the September 16 low of 139.58.
- For a bullish reversal, USD/JPY must surpass the Kijun-Sen at 143.44, with further hurdles at 144.00 and the recent high of 144.68.
The USD/JPY retreats after hitting a two-week high of 144.68, sliding some 0.28%. The Greenback is getting battered by worse-than-expected US data and falling US Treasury yields. This and investors' pricing in a 50-basis point (bps) rate cut by the Fed undermined the pair, which trades at 143.14.
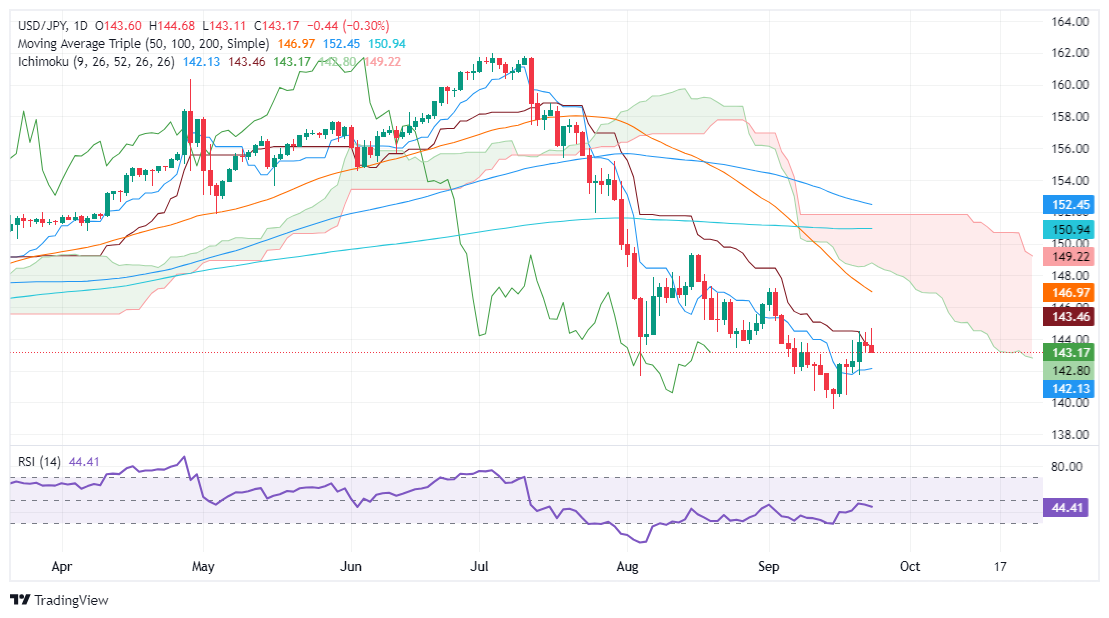
USD/JPY Price Forecast: Technical outlook
Despite testing the 144.00 figure for three consecutive trading days, the pair remains in a sustained downtrend. USD/JPY buyers failed to conquer the previously mentioned price level, spurring a leg-down on Tuesday.
The Relative Strength Index (RSI) hints that momentum favors sellers. USD/JPY remaining below the Ichimoku Cloud (Kumo) and the 200-day moving average (DMA) could pave the way for testing lower prices.
The next critical support level will be the September 20 low of 141.73, ahead of dropping to the September 16 low of 139.58.
Conversely, if USD/JPY edged toward the Kijun-Sen at 143.44 and clears that level, the pair could aim to challenge 144.00. Further upside is seen over the two-week high of 144.68.
USD/JPY Price Action – Daily Chart
Japanese Yen PRICE Today
The table below shows the percentage change of Japanese Yen (JPY) against listed major currencies today. Japanese Yen was the strongest against the US Dollar.
| USD | EUR | GBP | JPY | CAD | AUD | NZD | CHF | |
|---|---|---|---|---|---|---|---|---|
| USD | -0.60% | -0.50% | -0.30% | -0.80% | -0.78% | -1.17% | -0.50% | |
| EUR | 0.60% | 0.10% | 0.29% | -0.24% | -0.18% | -0.59% | 0.09% | |
| GBP | 0.50% | -0.10% | 0.19% | -0.30% | -0.27% | -0.69% | 0.00% | |
| JPY | 0.30% | -0.29% | -0.19% | -0.48% | -0.49% | -0.89% | -0.20% | |
| CAD | 0.80% | 0.24% | 0.30% | 0.48% | 0.02% | -0.38% | 0.31% | |
| AUD | 0.78% | 0.18% | 0.27% | 0.49% | -0.02% | -0.39% | 0.29% | |
| NZD | 1.17% | 0.59% | 0.69% | 0.89% | 0.38% | 0.39% | 0.70% | |
| CHF | 0.50% | -0.09% | -0.01% | 0.20% | -0.31% | -0.29% | -0.70% |
The heat map shows percentage changes of major currencies against each other. The base currency is picked from the left column, while the quote currency is picked from the top row. For example, if you pick the Japanese Yen from the left column and move along the horizontal line to the US Dollar, the percentage change displayed in the box will represent JPY (base)/USD (quote).
Information on these pages contains forward-looking statements that involve risks and uncertainties. Markets and instruments profiled on this page are for informational purposes only and should not in any way come across as a recommendation to buy or sell in these assets. You should do your own thorough research before making any investment decisions. FXStreet does not in any way guarantee that this information is free from mistakes, errors, or material misstatements. It also does not guarantee that this information is of a timely nature. Investing in Open Markets involves a great deal of risk, including the loss of all or a portion of your investment, as well as emotional distress. All risks, losses and costs associated with investing, including total loss of principal, are your responsibility. The views and opinions expressed in this article are those of the authors and do not necessarily reflect the official policy or position of FXStreet nor its advertisers. The author will not be held responsible for information that is found at the end of links posted on this page.
If not otherwise explicitly mentioned in the body of the article, at the time of writing, the author has no position in any stock mentioned in this article and no business relationship with any company mentioned. The author has not received compensation for writing this article, other than from FXStreet.
FXStreet and the author do not provide personalized recommendations. The author makes no representations as to the accuracy, completeness, or suitability of this information. FXStreet and the author will not be liable for any errors, omissions or any losses, injuries or damages arising from this information and its display or use. Errors and omissions excepted.
The author and FXStreet are not registered investment advisors and nothing in this article is intended to be investment advice.


Recommended content
Editors’ Picks

GBP/USD stays pressured below 1.3300 after UK Retail Sales data
GBP/USD remains under moderate selling pressure below 1.3300 despite the upbeat UK Retail Sales data for March. The pair feels the heat of the solid US Dollar rebound, aided by a Bloomberg report, which indicated China may suspend its 125% tariff on select US imports.

EUR/USD slides toward 1.1300 as US Dollar jumps on US-China trade optimism
EUR/USD extends the drop toward 1.1300 in European trading on Friday. Broad US Dollar resurgence on optimism surrounding the US-China trade war de-escalation weighs heavily on the pair. Trade talks and US data remain in focus.

Gold price drifts lower as US-China trade deal hopes undermine safe-haven assets
Gold price bulls seem reluctant as a positive risk tone undermines demand for safe-haven assets. Thursday’s upbeat US macro data supports the USD, contributing to capping the precious metal. Geopolitical uncertainties and Fed rate cut bets should help limit losses for the XAU/USD pair.

Ethereum: Accumulation addresses grab 1.11 million ETH as bullish momentum rises
Ethereum saw a 1% decline on Friday as sellers dominated exchange activity in the past 24 hours. Despite the recent selling, increased inflows into accumulation addresses and declining net taker volume show a gradual return of bullish momentum.

Five fundamentals for the week: Traders confront the trade war, important surveys, key Fed speech Premium
Will the US strike a trade deal with Japan? That would be positive progress. However, recent developments are not that positive, and there's only one certainty: headlines will dominate markets. Fresh US economic data is also of interest.

The Best brokers to trade EUR/USD
SPONSORED Discover the top brokers for trading EUR/USD in 2025. Our list features brokers with competitive spreads, fast execution, and powerful platforms. Whether you're a beginner or an expert, find the right partner to navigate the dynamic Forex market.