USD/JPY Price Forecast: Sinks below 200-day SMA as USD tumbles
- USD/JPY falls to 152.02, erasing February 12 gains as sellers take control.
- Bearish RSI signals further downside; key support at 150.93 and 148.64.
- A recovery above 152.73 could open the door to 153.22 and 154.00.

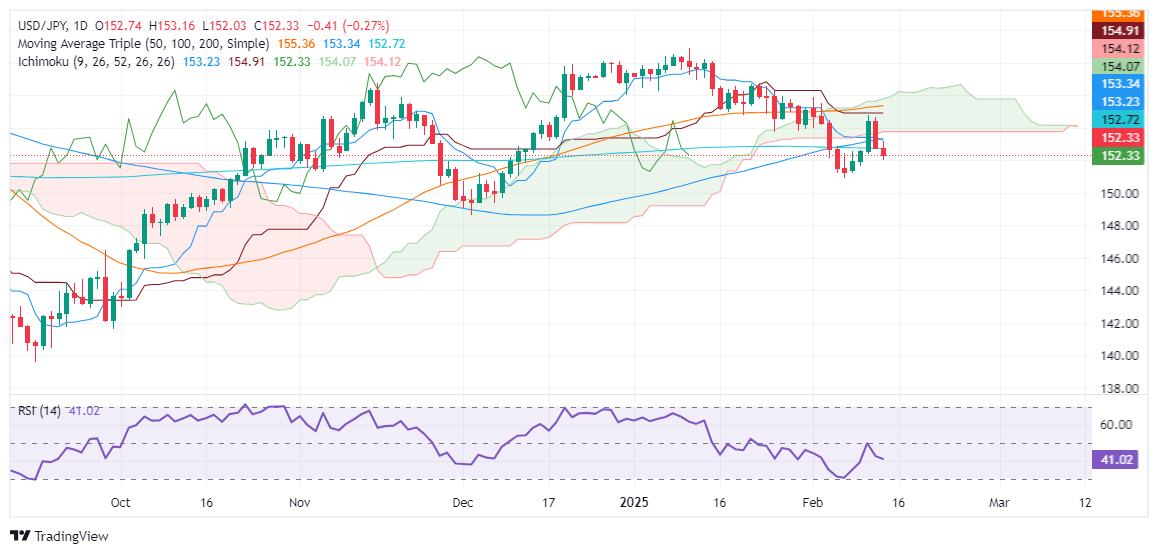
The USD/JPY extended its losses, dropping below the 200-day Simple Moving Average (SMA) of 152.73 and hitting a three-day low of 152.02. Worse than expected, US Retail Sales data weighed on the American currency, which has fallen to a year-to-date (YTD) low, according to the US Dollar Index (DXY). The pair trades at 152.26, below its opening price by 0.36%.
USD/JPY Price Forecast: Technical outlook
The downtrend resumed after the February 12 gains were erased during the last few days as sellers regained control. The Relative Strength Index (RSI) remains bearish, an indication that further downside lies ahead. Therefore, the USD/JPY's first support would be the February 7 swing low of 150.93, followed by the December 3 daily low of 148.64.
Conversely, if USD/JPY reclaims the 200-day SMA, the pair could aim for 153.00, followed by the Tenkan-sen at 153.22 and the 154.00 figure.
USD/JPY Price Chart – Daily
Japanese Yen PRICE Today
The table below shows the percentage change of Japanese Yen (JPY) against listed major currencies today. Japanese Yen was the strongest against the US Dollar.
| USD | EUR | GBP | JPY | CAD | AUD | NZD | CHF | |
|---|---|---|---|---|---|---|---|---|
| USD | -0.29% | -0.20% | -0.29% | -0.10% | -0.57% | -1.01% | -0.37% | |
| EUR | 0.29% | 0.08% | 0.00% | 0.18% | -0.29% | -0.73% | -0.08% | |
| GBP | 0.20% | -0.08% | -0.06% | 0.10% | -0.37% | -0.81% | -0.16% | |
| JPY | 0.29% | 0.00% | 0.06% | 0.17% | -0.30% | -0.74% | -0.10% | |
| CAD | 0.10% | -0.18% | -0.10% | -0.17% | -0.48% | -0.91% | -0.27% | |
| AUD | 0.57% | 0.29% | 0.37% | 0.30% | 0.48% | -0.45% | 0.20% | |
| NZD | 1.01% | 0.73% | 0.81% | 0.74% | 0.91% | 0.45% | 0.65% | |
| CHF | 0.37% | 0.08% | 0.16% | 0.10% | 0.27% | -0.20% | -0.65% |
The heat map shows percentage changes of major currencies against each other. The base currency is picked from the left column, while the quote currency is picked from the top row. For example, if you pick the Japanese Yen from the left column and move along the horizontal line to the US Dollar, the percentage change displayed in the box will represent JPY (base)/USD (quote).
Author

Christian Borjon Valencia
FXStreet
Markets analyst, news editor, and trading instructor with over 14 years of experience across FX, commodities, US equity indices, and global macro markets.


