• USD/JPY rallies over 0.8% as US yields jump and risk sentiment improves.
  • Price clears 150.00 and Kijun-Sen, RSI momentum favors further upside for bulls.
  • 151.80–152.70 range now key resistance; failure to hold 150 risks deeper pullback.

The USD/JPY pair surged on Monday and climbed above the 150.00 mark for the first time since early March as tariff fears faded and US Treasury bond yields skyrocketed, pushing the major for over 0.81%.

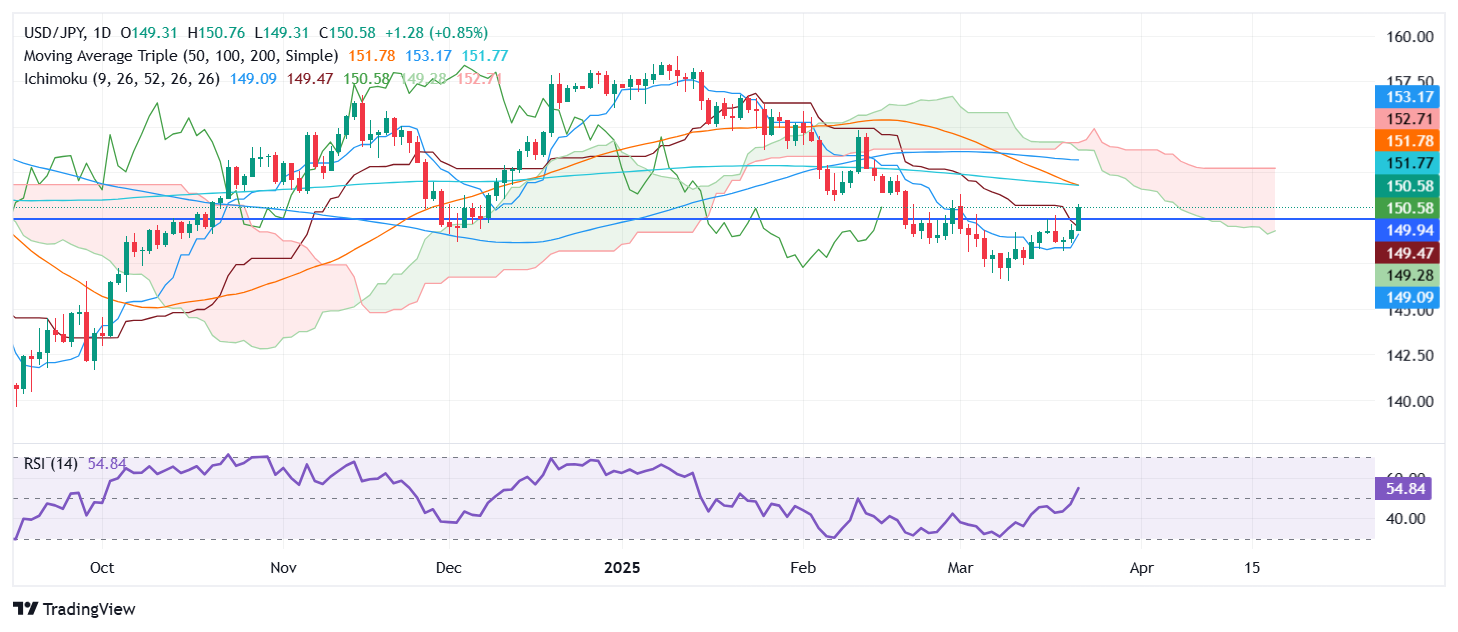
USD/JPY Price Forecast: Technical outlook

The USD/JPY cleared key resistance levels on Monday: first, the Kijun-Sen at 149.47, followed by the 150.00 figure. Buyers are gathering momentum, as depicted by the Relative Strength Index (RSI) punching through the 50 neutral line, suggesting that bulls could push prices past key strong resistance levels.

The 200-day and 50-day Simple Moving Averages (SMAs) confluence, at 151.79/82, respectively, emerges as a crucial ceiling and could be tested in the near term. If surpassed, the next significant resistance level would be the Senkou Span B, at 152.71.

Conversely, if USD/JPY retreats below 150.00, immediate support would be the Kijun-Sen and the Senkou Span A at 149.28. A breach of the latter will expose the Tenkan-Sen at 149.08.

USD/JPY Price Chart – Daily

Japanese Yen PRICE Today

The table below shows the percentage change of Japanese Yen (JPY) against listed major currencies today. Japanese Yen was the strongest against the Euro.

  USD EUR GBP JPY CAD AUD NZD CHF
USD   0.15% -0.04% 0.84% -0.24% -0.15% 0.16% 0.02%
EUR -0.15%   -0.30% 0.18% -0.34% -0.33% 0.05% -0.09%
GBP 0.04% 0.30%   0.88% -0.68% -0.06% 0.36% 0.10%
JPY -0.84% -0.18% -0.88%   -1.08% -1.01% -0.65% -0.83%
CAD 0.24% 0.34% 0.68% 1.08%   0.14% 0.41% 0.26%
AUD 0.15% 0.33% 0.06% 1.01% -0.14%   0.39% 0.23%
NZD -0.16% -0.05% -0.36% 0.65% -0.41% -0.39%   -0.08%
CHF -0.02% 0.09% -0.10% 0.83% -0.26% -0.23% 0.08%  

The heat map shows percentage changes of major currencies against each other. The base currency is picked from the left column, while the quote currency is picked from the top row. For example, if you pick the Japanese Yen from the left column and move along the horizontal line to the US Dollar, the percentage change displayed in the box will represent JPY (base)/USD (quote).


Share: Feed news

Information on these pages contains forward-looking statements that involve risks and uncertainties. Markets and instruments profiled on this page are for informational purposes only and should not in any way come across as a recommendation to buy or sell in these assets. You should do your own thorough research before making any investment decisions. FXStreet does not in any way guarantee that this information is free from mistakes, errors, or material misstatements. It also does not guarantee that this information is of a timely nature. Investing in Open Markets involves a great deal of risk, including the loss of all or a portion of your investment, as well as emotional distress. All risks, losses and costs associated with investing, including total loss of principal, are your responsibility. The views and opinions expressed in this article are those of the authors and do not necessarily reflect the official policy or position of FXStreet nor its advertisers. The author will not be held responsible for information that is found at the end of links posted on this page.

If not otherwise explicitly mentioned in the body of the article, at the time of writing, the author has no position in any stock mentioned in this article and no business relationship with any company mentioned. The author has not received compensation for writing this article, other than from FXStreet.

FXStreet and the author do not provide personalized recommendations. The author makes no representations as to the accuracy, completeness, or suitability of this information. FXStreet and the author will not be liable for any errors, omissions or any losses, injuries or damages arising from this information and its display or use. Errors and omissions excepted.

The author and FXStreet are not registered investment advisors and nothing in this article is intended to be investment advice.

Recommended content


Recommended content

Editors’ Picks

EUR/USD rebounds from multi-week low, climbs to 1.0780 area amid USD downtick

EUR/USD rebounds from multi-week low, climbs to 1.0780 area amid USD downtick

The EUR/USD pair rebounds from over a three-week low, around the 1.0735-1.0730 area touched during the Asian session on Thursday, and for now seems to have snapped a six-day losing streak. The momentum lifts spot prices to the 1.0780 region, or a fresh daily high in the last hour, and is sponsored by renewed US Dollar selling bias. 

EUR/USD News
GBP/USD rises above 1.2900 as US yields decline, Q4 GDP Annualized report eyed

GBP/USD rises above 1.2900 as US yields decline, Q4 GDP Annualized report eyed

GBP/USD recovers its recent losses from the previous session, climbing to around 1.2910 during Thursday’s Asian session. The pair is strengthening as the US Dollar remains under pressure due to declining Treasury yields, with the 2-year and 10-year yields hovering at 4.0% and 4.34%, respectively.

GBP/USD News
Gold price refreshes weekly top; seems poised to appreciate further amid trade jitters

Gold price refreshes weekly top; seems poised to appreciate further amid trade jitters

Gold price regains positive traction on Thursday as rising trade tensions boost safe-haven demand. A modest USD pullback from a multi-week top and Fed rate cut bets also back the XAU/USD pair. Traders look to Thursday’s US macro releases for some impetus ahead of the US PCE data on Friday.

Gold News
Cardano bulls target double-digit gains as bullish bets increase among traders

Cardano bulls target double-digit gains as bullish bets increase among traders

Cardano price hovers around $0.74 at the time of writing on Thursday after a recovery of over 4% so far this week. On-chain data hints at a bullish picture as ADA’s stablecoin market cap rises while its bullish bets increase among traders.

Read more
Sticky UK services inflation shows signs of tax hike impact

Sticky UK services inflation shows signs of tax hike impact

There are tentative signs that the forthcoming rise in employer National Insurance is having an impact on service sector inflation, which came in a tad higher than expected in February. It should still fall back in the second quarter, though, keeping the Bank of England on track for three further rate cuts this year.

Read more
The Best brokers to trade EUR/USD

The Best brokers to trade EUR/USD

SPONSORED Discover the top brokers for trading EUR/USD in 2025. Our list features brokers with competitive spreads, fast execution, and powerful platforms. Whether you're a beginner or an expert, find the right partner to navigate the dynamic Forex market.

Read More

Forex MAJORS

Cryptocurrencies

Signatures

Best Brokers of 2025