|

USD/JPY Price Analysis: Yen pair renews six-month high below 139.00 key upside hurdle

  • USD/JPY extends the previous day’s recovery to refresh multi-day top.
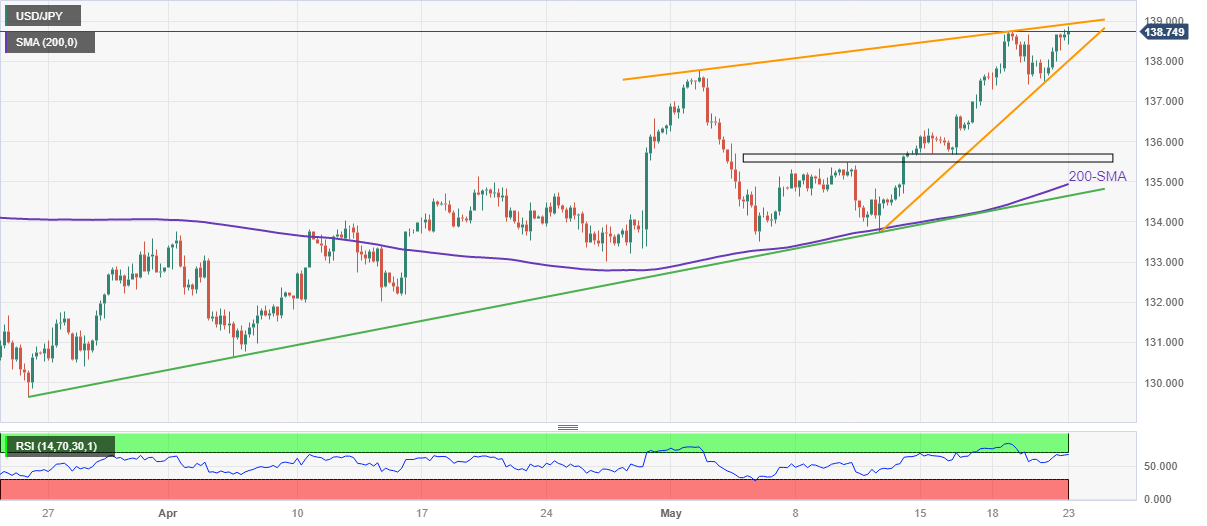
  • Three-week-old ascending resistance line can join overbought RSI (14) to challenge Yen pair buyers.
  • Ascending triangle restricts immediate moves, bears stay off the table unless witnessing break of two-month-long support line.

USD/JPY rises to the highest levels since the last November as it cheers the broad US Dollar strength while extending Monday’s rebound amid early Tuesday in Europe. With this, the Yen pair prints mild gains around 138.80 by the press time.

In doing so, the USD/JPY remains firmer inside a three-week-old ascending triangle, approaching the top line of the chart pattern of late. It’s worth noting, however, that the overbought RSI (14) could join the stated immediate hurdle near 139.00 to challenge the Yen pair buyers.

Even if the quote manages to cross the 139.00 hurdle, the November 30, 2022, peak of around 139.90 and the 140.00 round figure may act as additional upside filters to challenge the bulls before giving them control. Following that, the September 2022 low of 140.35 may act as the last defense of the USD/JPY bears.

On the other hand, the USD/JPY pair’s pullback remains elusive unless the quote stays beyond the aforementioned triangle’s lower line, close to the 138.00 threshold.

In a case where the Yen pair breaks the 138.00 support, one-week-old horizontal support near the mid-135.00s and the 200-SMA level of near 134.90 can challenge the bears.

It should be observed that the USD/JPY sellers need validation from an upward-sloping support line from late March, close to 134.65 at the latest, to retake control.

Overall, USD/JPY is likely to remain firmer but the road towards the north is long and bumpy.

USD/JPY: Four-hour chart

Trend: Limited upside expected

Additional important levels

Overview
Today last price138.81
Today Daily Change0.21
Today Daily Change %0.15%
Today daily open138.6
 
Trends
Daily SMA20135.79
Daily SMA50133.97
Daily SMA100133.22
Daily SMA200137.15
 
Levels
Previous Daily High138.69
Previous Daily Low137.49
Previous Weekly High138.75
Previous Weekly Low135.65
Previous Monthly High136.56
Previous Monthly Low130.63
Daily Fibonacci 38.2%138.23
Daily Fibonacci 61.8%137.95
Daily Pivot Point S1137.83
Daily Pivot Point S2137.06
Daily Pivot Point S3136.64
Daily Pivot Point R1139.03
Daily Pivot Point R2139.46
Daily Pivot Point R3140.22

Author

Anil Panchal

Anil Panchal

FXStreet

Anil Panchal has nearly 15 years of experience in tracking financial markets. With a keen interest in macroeconomics, Anil aptly tracks global news/updates and stays well-informed about the global financial moves and their implications.

More from Anil Panchal
Share:

Editor's Picks

EUR/USD hits fresh 2026 lows near 1.1570

EUR/USD adds to Monday’s heavy losses and reaches new yearly lows around 1.1570 on Tuesday. The pair’s deep pullback comes as the US Dollar extend its strong bounce, always propped up by the intense flight-to-safety environment amid the deteriorating geopolitical landscape in the Middle East.

GBP/USD attacks 1.3300, refreshing three-month lows

GBP/USD is deep in the red near 1.3300, accelerating its downside to renew three-month lows in European trading on Tuesday. The ongoing escalation in the Iran war, combined with rising Oil prices, weighs negatively on the higher-yielding Pound Sterling as the US Dollar capitalizes on increased haven demand.

Gold drops further, threatens $5,000

Gold comes under renewed and marked selling pressure on Tuesday, dangerously approaching the critical $5,000 mark per troy ounce, reversing at the same time four consecutive daily advances. The yellow metal’s bearish tone comes on the back of the increasing demand for the Greenback and investors’ repricing of Fed rate cuts.

Crypto Today: Bitcoin, Ethereum, XRP pull back as sentiment remains in extreme market fear

The cryptocurrency market is broadly in the red on Tuesday as the Middle East grapples with an escalating war. Bitcoin (BTC) is in a pullback, trading below $67,000 at the time of writing, and most altcoins follow suit.

Energy shock 2.0: Why rising Gas prices could hit the Euro

Even without a confirmed, sustained disruption, the mere risk to a key global energy chokepoint is enough to inject a significant premium into European Gas markets. And for the Euro, that matters.

Ripple falters amid sell-off jitters and negative funding rates

Ripple (XRP) has come under pressure, drifting lower to $1.35 at the time of writing on Tuesday. The over 2% correction looks poised to erase the previous day’s gains, which lifted the remittance token to $1.42.