USD/JPY Price Analysis: Bulls take a breather on their way to 134.50


  • USD/JPY remains sidelined after rising to the highest levels in one month.
  • Upbeat oscillators, clear break of the key DMAs keep Yen pair buyers hopeful.
  • Descending resistance line from late October 2022 challenges USD/JPY bulls ahead of 200-DMA.
  • Bears need validation from 133.25 to aim for three-month-long rising support line.

USD/JPY picks up bids to reverse the early Asian session pullback from a one-month high as it prints mild gains around 133.80 amid the initial hours of Wednesday’s European trading session.

In doing so, the Yen pair rises for the fifth consecutive day even as bulls pause around the multi-day top.

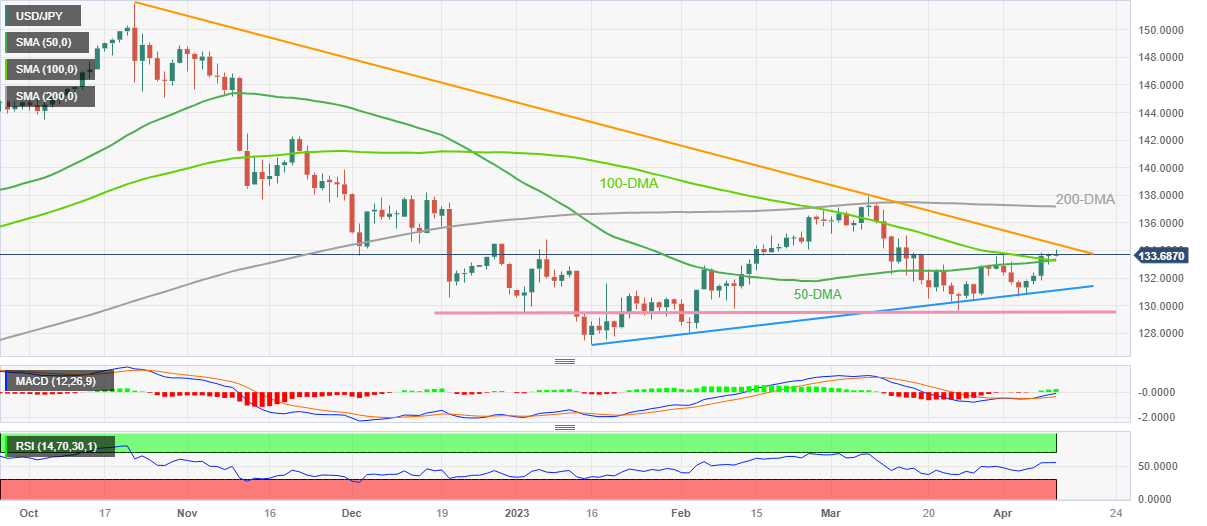
The quote’s latest run-up could be linked to the bullish MACD signals and the upbeat RSI (14) not overbought. More importantly, a clear upside break of the 100-DMA and 50-DMA convergence, near 133.35-25, keeps the USD/JPY buyers hopeful.

However, a downward-sloping resistance line from October 2022, around 134.50 by the press time, appears a tough nut to crack for the Yen pair buyers.

Following that, the 200-DMA hurdle of around 137.20 acts as the last defense of the USD/JPY bears.

On the flip side, a daily closing below the previously stated DMA confluence, near 133.35-25, could quickly drag the USD/JPY prices towards a three-month-long ascending support line, close to 131.10 at the latest.

Above all, a horizontal area comprising multiple lows marked since early January, near 129.50, becomes a crucial support for the USD/JPY bears to watch as a break of which can challenge the Year-To-Date (YTD) low of 127.21 marked in January.

USD/JPY: Daily chart

Trend: Limited upside expected

Additional important levels

Overview
Today last price 133.74
Today Daily Change 0.07
Today Daily Change % 0.05%
Today daily open 133.67
 
Trends
Daily SMA20 132.17
Daily SMA50 133.26
Daily SMA100 133.32
Daily SMA200 137.2
 
Levels
Previous Daily High 133.81
Previous Daily Low 132.97
Previous Weekly High 133.76
Previous Weekly Low 130.63
Previous Monthly High 137.91
Previous Monthly Low 129.64
Daily Fibonacci 38.2% 133.49
Daily Fibonacci 61.8% 133.29
Daily Pivot Point S1 133.16
Daily Pivot Point S2 132.65
Daily Pivot Point S3 132.33
Daily Pivot Point R1 133.99
Daily Pivot Point R2 134.32
Daily Pivot Point R3 134.82


Share: Feed news

Information on these pages contains forward-looking statements that involve risks and uncertainties. Markets and instruments profiled on this page are for informational purposes only and should not in any way come across as a recommendation to buy or sell in these assets. You should do your own thorough research before making any investment decisions. FXStreet does not in any way guarantee that this information is free from mistakes, errors, or material misstatements. It also does not guarantee that this information is of a timely nature. Investing in Open Markets involves a great deal of risk, including the loss of all or a portion of your investment, as well as emotional distress. All risks, losses and costs associated with investing, including total loss of principal, are your responsibility. The views and opinions expressed in this article are those of the authors and do not necessarily reflect the official policy or position of FXStreet nor its advertisers. The author will not be held responsible for information that is found at the end of links posted on this page.

If not otherwise explicitly mentioned in the body of the article, at the time of writing, the author has no position in any stock mentioned in this article and no business relationship with any company mentioned. The author has not received compensation for writing this article, other than from FXStreet.

FXStreet and the author do not provide personalized recommendations. The author makes no representations as to the accuracy, completeness, or suitability of this information. FXStreet and the author will not be liable for any errors, omissions or any losses, injuries or damages arising from this information and its display or use. Errors and omissions excepted.

The author and FXStreet are not registered investment advisors and nothing in this article is intended to be investment advice.

XM
Account
7.2
Tools
9.2
Service
9.4
Trading
9.0
Trust
7.0
Experience
8.4
Read review
Moneta Markets
Account
7.4
Tools
6.6
Service
8.0
Trading
6.6
Trust
5.2
Experience
9.2
Read review
Trading Pro
Account
7.2
Tools
5.2
Service
6.6
Trading
8.0
Trust
5.0
Experience
7.0
Read review
Pepperstone
Account
8.2
Tools
8.2
Service
7.4
Trading
9.0
Trust
8.8
Experience
9.0
Read review
XM
Read review
Moneta Markets
Read review
Trading Pro
Read review
Pepperstone
Read review
Trading Pro
Read review
Pepperstone
Read review
XM
Read review
Moneta Markets
Read review
Trading Pro
Account
7.2
Tools
5.2
Service
6.6
Trading
8.0
Trust
5.0
Experience
7.0
Read review
Pepperstone
Account
8.2
Tools
8.2
Service
7.4
Trading
9.0
Trust
8.8
Experience
9.0
Read review
XM
Account
7.2
Tools
9.2
Service
9.4
Trading
9.0
Trust
7.0
Experience
8.4
Read review
Moneta Markets
Account
7.4
Tools
6.6
Service
8.0
Trading
6.6
Trust
5.2
Experience
9.2
Read review

Recommended content


Recommended content

Editors’ Picks

Gold moves to record highs past $3,340

Gold moves to record highs past $3,340 Premium

Gold now gathers extra steam and advances beyond the $3,340 mark per troy ounce on Wednesday, hitting all-time highs amid ongoing worries over escalating US-China trade tensions, a weaker US Dollar and lack of news from Powell's speech.

Gold News
Australian Dollar receives support from improved global risk mood, US Retail Sales eyed

Australian Dollar receives support from improved global risk mood, US Retail Sales eyed

The Australian Dollar extends its winning streak against the US Dollar for a sixth consecutive session on Wednesday, with the AUD/USD pair holding firm after the release of Australia’s Westpac Leading Index. The index’s six-month annualised growth rate eased to 0.6% in March from 0.9% in February.

AUD/USD News
EUR/USD remains in a consolidative range below 1.1400

EUR/USD remains in a consolidative range below 1.1400

EUR/USD navigates the latter part of Wednesday’s session with marked gains, although another test of the 1.1400 level remained elusive. The strong bounce in spot came on the back of a marked move lower in the US Dollar, which remained apathetic following the neutral stance from Chair Powell.

EUR/USD News
Bitcoin stabilizes around $83,000 as China opens trade talks with President Trump’s administration

Bitcoin stabilizes around $83,000 as China opens trade talks with President Trump’s administration

Bitcoin price stabilizes around $83,500 on Wednesday after facing multiple rejections around the 200-day EMA. Bloomberg reports that China is open to trade talks with President Trump’s administration.

Read more
Future-proofing portfolios: A playbook for tariff and recession risks

Future-proofing portfolios: A playbook for tariff and recession risks

It does seem like we will be talking tariffs for a while. And if tariffs stay — in some shape or form — even after negotiations, we’ll likely be talking about recession too. Higher input costs, persistent inflation, and tighter monetary policy are already weighing on global growth. 

Read more
The Best brokers to trade EUR/USD

The Best brokers to trade EUR/USD

SPONSORED Discover the top brokers for trading EUR/USD in 2025. Our list features brokers with competitive spreads, fast execution, and powerful platforms. Whether you're a beginner or an expert, find the right partner to navigate the dynamic Forex market.

Read More

Forex MAJORS

Cryptocurrencies

Signatures

Best Brokers of 2025