USD/JPY Price Analysis: Yen bears appear well set to refresh weekly low around 132.90


  • USD/JPY fades bounce off eight-day low as 50-DMA challenges corrective bounce.
  • Impending bear cross on MACD, steady RSI favor continuation of the latest downside.
  • 100-DMA, 3.5-month-old ascending trend line appear tough nuts to crack for Yen pair sellers.

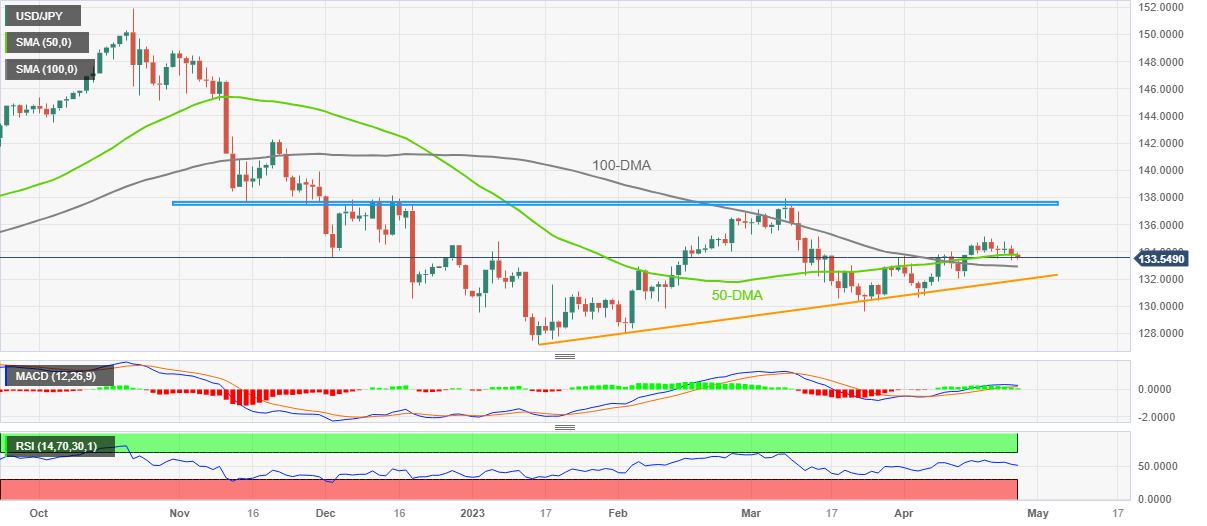
USD/JPY drops back towards the lowest levels in a week, mildly offered near 133.55 by the press time, as it defends the previous day’s downside break of the 50-DMA amid early Wednesday.

Adding strength to the bearish bias is the steady RSI (14) line around the 50.00 level, as well as the looming bear cross on the MACD indicator.

With this, the Yen pair is all set to revisit the eight-day low marked on Tuesday around 133.35. However, the 100-DMA support of near 132.90 could challenge the USD/JPY bears afterward.

In a case where the quote remains bearish past 132.90, an upward-sloping support line from the mid-January, close to 131.90 by the press time, will be the last defense of the Yen pair buyers as a break of which could open doors for the pair’s fall towards the yearly low of near 127.20.

Alternatively, a daily closing beyond the 50-DMA level of 133.80 becomes necessary for the USD/JPY buyers to take the risk of fresh entry.

Even so, the latest swing high around 135.15 and a horizontal area comprising multiple levels marked since November 2022, surrounding 133.45-70, will be a tough nut to crack for the Yen pair bulls.

To sum up, USD/JPY remains on the bear’s radar with the 50-DMA breakdown.

USD/JPY: Daily chart

Trend: Further downside expected

Additional important levels

Overview
Today last price 133.58
Today Daily Change -0.21
Today Daily Change % -0.16%
Today daily open 133.79
 
Trends
Daily SMA20 133.21
Daily SMA50 133.79
Daily SMA100 132.95
Daily SMA200 137.03
 
Levels
Previous Daily High 134.48
Previous Daily Low 133.37
Previous Weekly High 135.14
Previous Weekly Low 133.55
Previous Monthly High 137.91
Previous Monthly Low 129.64
Daily Fibonacci 38.2% 133.79
Daily Fibonacci 61.8% 134.05
Daily Pivot Point S1 133.28
Daily Pivot Point S2 132.77
Daily Pivot Point S3 132.17
Daily Pivot Point R1 134.39
Daily Pivot Point R2 134.99
Daily Pivot Point R3 135.5


Share: Feed news

Information on these pages contains forward-looking statements that involve risks and uncertainties. Markets and instruments profiled on this page are for informational purposes only and should not in any way come across as a recommendation to buy or sell in these assets. You should do your own thorough research before making any investment decisions. FXStreet does not in any way guarantee that this information is free from mistakes, errors, or material misstatements. It also does not guarantee that this information is of a timely nature. Investing in Open Markets involves a great deal of risk, including the loss of all or a portion of your investment, as well as emotional distress. All risks, losses and costs associated with investing, including total loss of principal, are your responsibility. The views and opinions expressed in this article are those of the authors and do not necessarily reflect the official policy or position of FXStreet nor its advertisers. The author will not be held responsible for information that is found at the end of links posted on this page.

If not otherwise explicitly mentioned in the body of the article, at the time of writing, the author has no position in any stock mentioned in this article and no business relationship with any company mentioned. The author has not received compensation for writing this article, other than from FXStreet.

FXStreet and the author do not provide personalized recommendations. The author makes no representations as to the accuracy, completeness, or suitability of this information. FXStreet and the author will not be liable for any errors, omissions or any losses, injuries or damages arising from this information and its display or use. Errors and omissions excepted.

The author and FXStreet are not registered investment advisors and nothing in this article is intended to be investment advice.

Recommended content


Recommended content

Editors’ Picks

EUR/USD stays in positive territory above 1.0850 after US data

EUR/USD stays in positive territory above 1.0850 after US data

EUR/USD clings to modest daily gains above 1.0850 in the second half of the day on Friday. The improving risk mood makes it difficult for the US Dollar to hold its ground after PCE inflation data, helping the pair edge higher ahead of the weekend.

EUR/USD News

GBP/USD stabilizes above 1.2850 as risk mood improves

GBP/USD stabilizes above 1.2850 as risk mood improves

GBP/USD maintains recovery momentum and fluctuates above 1.2850 in the American session on Friday. The positive shift seen in risk mood doesn't allow the US Dollar to preserve its strength and supports the pair.

GBP/USD News

Gold rebounds above $2,380 as US yields stretch lower

Gold rebounds above $2,380 as US yields stretch lower

Following a quiet European session, Gold gathers bullish momentum and trades decisively higher on the day above $2,380. The benchmark 10-year US Treasury bond yield loses more than 1% on the day after US PCE inflation data, fuelling XAU/USD's upside.

Gold News

Avalanche price sets for a rally following retest of key support level

Avalanche price sets for a rally following retest of  key support level

Avalanche (AVAX) price bounced off the $26.34 support level to trade at $27.95 as of Friday. Growing on-chain development activity indicates a potential bullish move in the coming days.

Read more

The election, Trump's Dollar policy, and the future of the Yen

The election, Trump's Dollar policy, and the future of the Yen

After an assassination attempt on former President Donald Trump and drop out of President Biden, Kamala Harris has been endorsed as the Democratic candidate to compete against Trump in the upcoming November US presidential election.

Read more

Forex MAJORS

Cryptocurrencies

Signatures